Abstract
Cassava mosaic disease (CMD) seriously affects cassava yields in Africa. This study compared the spatial distribution of CMD using three independent surveys in Rwanda and Burundi. Geostatistical techniques were used to interpolate the point‐based surveys and predict the spatial distributions of different measures of the disease. Correlative relationships were examined for 35 environmental and socio‐economic spatial variables of which 31 were correlated to CMD intensity, with the highest correlation coefficients for latitude (−0·47), altitude (−0·36) and temperature (+0·36). The most significant explanatory variables were entered in separate linear regression models for each of the surveys. The models explained 54%, 44% and 22% of the variation in CMD. The residuals of the regression models were interpolated using kriging and added to the regression models to map CMD across both countries. Significant differences were calculated in some areas after correcting for interpolation error. An important explanation of the differences is interaction between the CMD pandemic and the dates of the three surveys. Large relative prediction errors obtained in the regression kriging procedure show the need to improve the survey design and decrease measurement error. Improved maps of crop diseases such as CMD could aid targeting of control interventions and thereby contribute to increasing crop yields. This study validated the unique character of each of the survey approaches adopted and underlines the importance of specific interpretation of results for CMD management. The study emphasizes the need for optimization of sampling designs and survey protocols to maximize the potential of regression kriging.
Abstract from the paper’s OpenAlex record, shown for indexing and research. Copyright remains with the authors or the publisher. Read at the source ↗
The text the model read, with the source record’s inline markup (italics, sub- and superscripts) rendered and its character entities decoded; quote offsets refer to the raw text.
Claims 13
Claim · model-written summary
31 of 35 environmental and socio-economic variables were correlated with cassava mosaic disease intensity.
- Taxon
- cassava
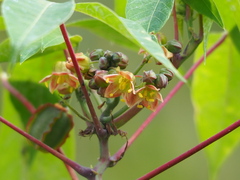 Manihot esculentat0
- Outcome
- CMD intensitye1
- Direction
- correlatede1
- Value
- 31e1
- Setting
- Rwanda and Burundie0
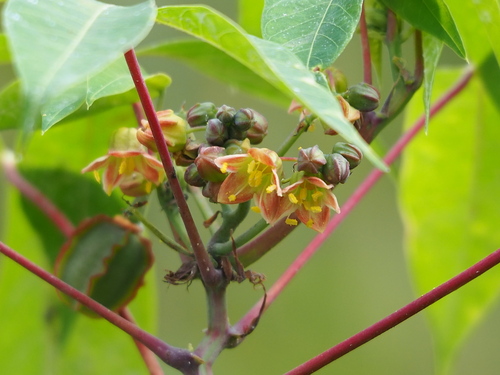
Organisms pictured · Representative pictures of the matched species, not figures from the paper.
Verbatim
t0“cassava mosaic virus disease”
e0“using three independent surveys in Rwanda and Burundi”
e1“of which 31 were correlated to CMD intensity”
Claim · model-written summary
Latitude had the highest correlation coefficient with cassava mosaic disease intensity, -0.47.
- Taxon
- cassavaManihot esculentat0
- Outcome
- CMD intensitye1
- Direction
- higheste2
- Value
- −0·47e2
- Setting
- latitudee2
Organisms pictured · Representative pictures of the matched species, not figures from the paper.
Verbatim
t0“cassava mosaic virus disease”
e1“of which 31 were correlated to CMD intensity”
e2“with the highest correlation coefficients for latitude (−0·47), altitude (−0·36) and temperature (+0·36)”
Claim · model-written summary
Altitude had a high correlation coefficient with cassava mosaic disease intensity, -0.36.
- Taxon
- cassavaManihot esculentat0
- Outcome
- CMD intensitye1
- Direction
- higheste2
- Value
- −0·36e2
- Setting
- altitudee2
Organisms pictured · Representative pictures of the matched species, not figures from the paper.
Verbatim
t0“cassava mosaic virus disease”
e1“of which 31 were correlated to CMD intensity”
e2“with the highest correlation coefficients for latitude (−0·47), altitude (−0·36) and temperature (+0·36)”
Claim · model-written summary
Temperature had a high correlation coefficient with cassava mosaic disease intensity, +0.36.
- Taxon
- cassavaManihot esculentat0
- Outcome
- CMD intensitye1
- Direction
- higheste2
- Value
- +0·36e2
- Setting
- temperaturee2
Organisms pictured · Representative pictures of the matched species, not figures from the paper.
Verbatim
t0“cassava mosaic virus disease”
e1“of which 31 were correlated to CMD intensity”
e2“with the highest correlation coefficients for latitude (−0·47), altitude (−0·36) and temperature (+0·36)”
Claim · model-written summary
The regression model explained 54% of the variation in cassava mosaic disease.
- Taxon
- cassavaManihot esculentat0
- Treatment
- most significant explanatory variablese4
- Outcome
- variation in CMDe3
- Value
- 54%e3
Not reportedDirection
Organisms pictured · Representative pictures of the matched species, not figures from the paper.
Verbatim
t0“cassava mosaic virus disease”
e3“The models explained 54%, 44% and 22% of the variation in CMD”
e4“The most significant explanatory variables were entered in separate linear regression models for each of the surveys”
Claim · model-written summary
The regression model explained 44% of the variation in cassava mosaic disease.
- Taxon
- cassavaManihot esculentat0
- Treatment
- most significant explanatory variablese4
- Outcome
- variation in CMDe3
- Value
- 44%e3
Not reportedDirection
Organisms pictured · Representative pictures of the matched species, not figures from the paper.
Verbatim
t0“cassava mosaic virus disease”
e3“The models explained 54%, 44% and 22% of the variation in CMD”
e4“The most significant explanatory variables were entered in separate linear regression models for each of the surveys”
Claim · model-written summary
The regression model explained 22% of the variation in cassava mosaic disease.
- Taxon
- cassavaManihot esculentat0
- Treatment
- most significant explanatory variablese4
- Outcome
- variation in CMDe3
- Value
- 22%e3
Not reportedDirection
Organisms pictured · Representative pictures of the matched species, not figures from the paper.
Verbatim
t0“cassava mosaic virus disease”
e3“The models explained 54%, 44% and 22% of the variation in CMD”
e4“The most significant explanatory variables were entered in separate linear regression models for each of the surveys”
Claim · model-written summary
Significant differences in cassava mosaic disease mapping were calculated in some areas after correcting for interpolation error.
- Taxon
- cassavaManihot esculentat0
- Outcome
- Significant differencese5
- Qualifier
- in some areas after correcting for interpolation errore5
Organisms pictured · Representative pictures of the matched species, not figures from the paper.
Verbatim
t0“cassava mosaic virus disease”
e5“Significant differences were calculated in some areas after correcting for interpolation error”
Claim · model-written summary
Interaction between the CMD pandemic and the dates of the three surveys is an important explanation of the differences between surveys.
- Taxon
- cassavaManihot esculentat0
- Outcome
- differencese6
- Qualifier
- interaction between the CMD pandemic and the dates of the three surveyse6
Organisms pictured · Representative pictures of the matched species, not figures from the paper.
Verbatim
t0“cassava mosaic virus disease”
e6“An important explanation of the differences is interaction between the CMD pandemic and the dates of the three surveys”
Claim · model-written summary
Relative prediction errors of the regression kriging procedure were large.
- Taxon
- cassavaManihot esculentat0
- Outcome
- relative prediction errorse7
- Value
- Largee7
Organisms pictured · Representative pictures of the matched species, not figures from the paper.
Verbatim
t0“cassava mosaic virus disease”
e7“Large relative prediction errors obtained in the regression kriging procedure show the need to improve the survey design and decrease measurement error”
Claim · model-written summary
The authors recommend improving the survey design and decreasing measurement error.
- Taxon
- cassavaManihot esculentat0
- Outcome
- improve the survey design and decrease measurement errore7
Organisms pictured · Representative pictures of the matched species, not figures from the paper.
Verbatim
t0“cassava mosaic virus disease”
e7“Large relative prediction errors obtained in the regression kriging procedure show the need to improve the survey design and decrease measurement error”
Claim · model-written summary
Improved maps of cassava mosaic disease could aid targeting of control interventions.
- Taxon
- cassavaManihot esculentat0
- Outcome
- targeting of control interventionse0
Organisms pictured · Representative pictures of the matched species, not figures from the paper.
Verbatim
t0“cassava mosaic virus disease”
e0“Improved maps of crop diseases such as CMD could aid targeting of control interventions and thereby contribute to increasing crop yields”
Claim · model-written summary
The authors recommend optimizing sampling designs and survey protocols for regression kriging.
- Taxon
- cassavaManihot esculentat0
- Outcome
- optimization of sampling designs and survey protocolse0
Organisms pictured · Representative pictures of the matched species, not figures from the paper.
Verbatim
t0“cassava mosaic virus disease”
e0“The study emphasizes the need for optimization of sampling designs and survey protocols”