Abstract
Forest ecosystems are characterized by a vast biological diversity, comprising millions of plants, animals, fungi, and microorganisms, which interact and form complex food chains and interdependencies. Forest ecosystems contain several strata, from the litter vegetation and shrubs to the tree tops, each supporting an array of life forms and performing specific functions. The upper tier of forest provides the protection from the sun, thus controlling the microclimate at the lower levels, influencing the temperatire and soil humidity. Forests play a crucial role in the global biogeochemical cycles, such as carbon and water cycles. Trees consume carbon dioxide emissions from the atmosphere and produce oxygen through phosynthesis, mitigating the climate change. Water circulates through forest ecosystems, evaporates from the leaf surface, condenses in the clouds, and returns back to Earth as precipitation. Forest ecosystems continuously change subject to both natural and anthropogenic factors. Forests provide a variety of ecosystemic services, ranging from regulation of climate and preservation of soils to filtration of water and support of biodiversity. They also serve as living places for numerous vulnerable and endemic species, thus performing the role of natural reservoirs of genetic resources. Therefore, forest ecosystems are extremely ecologically valuable, and their preservation is crucial to a balanced functioning of the planet. Our studies were conducted in the forest ecosystems of the Desna-Stara Huta National Nature Park, located in the Ukrainian Polissia. The materials and methods of the study included systematic collection of data on the frequency of occurrence of vegetatively propagated herbs and shrubs in forest ecosystems of the Ukrainian Polissia. For the data analysis, we used statistical methods. In the studied group of plants, the largest phytocoenotic ranges, which included 7–9 types of phytocoenoses, were observed for Vaccinium myrtillus and Maianthemum bifolium. Narrow phytocoenotic ranges, which included only 3-4 phytocoenoses, were noted for Calluna vulgaris and Aegopodium podagraria. The narrowing of phytocoenotic ranges of the forest herbs and shrubs was found attributable to the populations spreading farther away from their hytocoenotic optima. As the stress factors increased, the species and populations underwent the following transformations: decline in the level of productive process, with decrease in the size of phytomass of individuals – diminution of plant size; their reproductive potential; reduced population density; changes in the age composition of populations, where the share of plants of older ages increased, while the share of pre-generative plants declined; changes in the vital structure of populations that reflected their diversity by vital condition, shifting from prospering to depressing. In total, those processes act as a limiting mechanism of expansion of the plants’ phytocoenotic ranges. The comparative analysis of the yielded results revealed that the species individuality of phytocoenotic ranges of forest herbaceous and shrub plants of the Ukrainian Polissia is characterized by two main parameters: the width of phytocoenotic range and the abundance distribution in the phytocoenoses within their phytocoenotic range.
Abstract from the paper’s OpenAlex record; open copy licensed cc-by. Read at the source ↗
The text the model read, with the source record’s inline markup (italics, sub- and superscripts) rendered and its character entities decoded; quote offsets refer to the raw text.
Claims 13
Claim · model-written summary
Vaccinium myrtillus occupied one of the largest phytocoenotic ranges, spanning 7–9 types.
- Taxon
- Vaccinium myrtillus
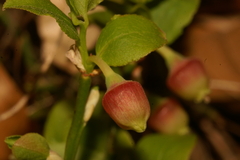 Vaccinium myrtilluse0
- Outcome
- phytocoenotic rangese0
- Direction
- largeste0
- Value
- 7–9 types of phytocoenosese0
Organisms pictured · Representative pictures of the matched species, not figures from the paper.

Verbatim
e0“largest phytocoenotic ranges, which included 7–9 types of phytocoenoses, were observed for Vaccinium myrtillus and Maianthemum bifolium”
Claim · model-written summary
Maianthemum bifolium occupied one of the largest phytocoenotic ranges, spanning 7–9 types.
- Taxon
- Maianthemum bifolium
 Maianthemum bifoliume0
- Outcome
- phytocoenotic rangese0
- Direction
- largeste0
- Value
- 7–9 types of phytocoenosese0
Organisms pictured · Representative pictures of the matched species, not figures from the paper.

Verbatim
e0“largest phytocoenotic ranges, which included 7–9 types of phytocoenoses, were observed for Vaccinium myrtillus and Maianthemum bifolium”
Claim · model-written summary
Calluna vulgaris had a narrow range covering 3-4 phytocoenoses.
- Taxon
- Calluna vulgaris
 Calluna vulgarise0
- Outcome
- phytocoenotic rangese0
- Direction
- Narrowe0
- Value
- 3-4 phytocoenosese0
Organisms pictured · Representative pictures of the matched species, not figures from the paper.

Verbatim
e0“Narrow phytocoenotic ranges, which included only 3-4 phytocoenoses, were noted for Calluna vulgaris and Aegopodium podagraria”
Claim · model-written summary
Aegopodium podagraria had a narrow range covering 3-4 phytocoenoses.
- Taxon
- Aegopodium podagraria
 Aegopodium podagrariae0
- Outcome
- phytocoenotic rangese0
- Direction
- Narrowe0
- Value
- 3-4 phytocoenosese0
Organisms pictured · Representative pictures of the matched species, not figures from the paper.

Verbatim
e0“Narrow phytocoenotic ranges, which included only 3-4 phytocoenoses, were noted for Calluna vulgaris and Aegopodium podagraria”
Claim · model-written summary
Range narrowing was attributed to populations moving away from phytocoenotic optima.
Verbatim
e0“The narrowing of phytocoenotic ranges of the forest herbs and shrubs was found attributable to the populations spreading farther away from their hytocoenotic optima”
Claim · model-written summary
Increasing stress was associated with reduced phytomass and plant size.
Verbatim
e0“As the stress factors increased, the species and populations underwent the following transformations: decline in the level of productive process, with decrease in the size of phytomass of individuals – diminution of plant size”
Claim · model-written summary
Increasing stress was associated with reduced reproductive potential.
Verbatim
e0“As the stress factors increased, the species and populations underwent the following transformations: decline in the level of productive process, with decrease in the size of phytomass of individuals – diminution of plant size; their reproductive potential”
Claim · model-written summary
Increasing stress was associated with lower population density.
Verbatim
e0“As the stress factors increased, the species and populations underwent the following transformations: decline in the level of productive process, with decrease in the size of phytomass of individuals – diminution of plant size; their reproductive potential; reduced population density”
Claim · model-written summary
Increasing stress was associated with a greater share of older plants.
- Taxon
- plantsViridiplantaee0
- Treatment
- stress factorse0
- Outcome
- share of plants of older agese0
- Direction
- increasede0
Verbatim
e0“As the stress factors increased, the species and populations underwent the following transformations: decline in the level of productive process, with decrease in the size of phytomass of individuals – diminution of plant size; their reproductive potential; reduced population density; changes in the age composition of populations, where the share of plants of older ages increased”
Claim · model-written summary
Increasing stress was associated with fewer pre-generative plants.
- Taxon
- plantsViridiplantaee0
- Treatment
- stress factorse1
- Outcome
- share of pre-generative plantse0
- Direction
- declinede0
Verbatim
e0“while the share of pre-generative plants declined”
e1“As the stress factors increased, the species and populations underwent the following transformations”
Claim · model-written summary
Population vital structure shifted from prospering to depressing under increased stress.
Verbatim
e0“changes in the vital structure of populations that reflected their diversity by vital condition, shifting from prospering to depressing”
e1“As the stress factors increased, the species and populations underwent the following transformations”
Claim · model-written summary
The authors describe stress-linked population changes as limiting range expansion.
- Taxon
- plantsViridiplantaee0
- Outcome
- expansion of the plants’ phytocoenotic rangese0
- Qualifier
- those processes act as a limiting mechanisme0
Verbatim
e0“In total, those processes act as a limiting mechanism of expansion of the plants’ phytocoenotic ranges”
Claim · model-written summary
Species-specific ranges were characterized by range width and abundance distribution.
Verbatim
e0“the species individuality of phytocoenotic ranges of forest herbaceous and shrub plants of the Ukrainian Polissia is characterized by two main parameters: the width of phytocoenotic range and the abundance distribution in the phytocoenoses within their phytocoenotic range”