Abstract
Microplot experiments were conducted in 1989 and 1990 to determine the relationship between yield of peanut (Arachis hypogaea) and inoculum density ofMeloidogyne arenaria race 1. Nine inoculum densities were used, ranging from 0-200 eggs/100 cm(3) soil (1989) or from 0-100 eggs/100 cm(3) (1990), and each density was replicated 10 times. In 1989, higher final densities (mean of 1,171 juveniles [J2]/100 cm(3) soil) were obtained in plots inoculated with 0.5 to 50 eggs/100 cm(3) soil than in plots inoculated with 100 to 200 eggs/100 cm(3) (313 J2/100 cm(3) soil). In 1990, final densities of M. arenaria reached high levels (>/= 1,111 J2/100 cm(3) soil) in all inoculated plots. Pod yield and dry weight of foliage at harvest were negatively correlated (P </= 0.05) with inoculum density in both seasons. In 1989, the relationship between pod weight (y) and initial density (x) was described by Seinhorst's equation, with y = 0.088 + 0.91(0.90)x(1) and r(2) = 0.826. In 1990, the relationship was y = 0.22 + 0.78(0.97)x(1) and r(2) = 0.794. These equations suggest tolerance limits of approximately 1 egg/100 cm(3) soil, which may require specialized methods, such as bioassay, for detection.
Abstract from the paper’s OpenAlex record, shown for indexing and research. Copyright remains with the authors or the publisher. Read at the source ↗
The text the model read, with the source record’s inline markup (italics, sub- and superscripts) rendered and its character entities decoded; quote offsets refer to the raw text.
Claims 7
Claim · model-written summary
Peanut pod yield and dry weight of foliage at harvest were negatively correlated with Meloidogyne arenaria inoculum density in both seasons.
- Taxon
- peanut
 Arachis hypogaeae1
- Material
- race 1e1
- Treatment
- inoculum densitye2
- Interactor
- Meloidogyne arenaria
 Meloidogyne arenariae1pest
- Outcome
- Pod yield and dry weight of foliage at harveste2
- Direction
- decreaseinferrede2
- Qualifier
- in both seasonse2
- Setting
- Microplot experimentse1
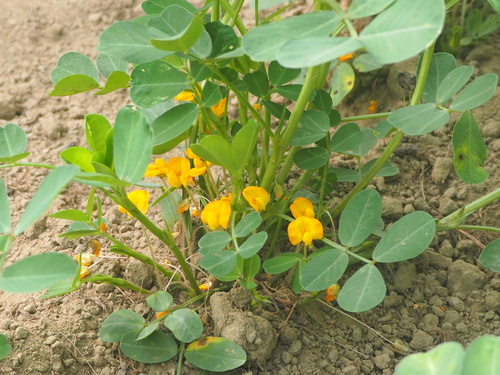
Organisms pictured · Representative pictures of the matched species, not figures from the paper.

Verbatim
e1“Microplot experiments were conducted in 1989 and 1990 to determine the relationship between yield of peanut (Arachis hypogaea) and inoculum density ofMeloidogyne arenaria race 1”
e2“Pod yield and dry weight of foliage at harvest were negatively correlated (P </= 0.05) with inoculum density in both seasons”
Claim · model-written summary
In 1989, higher final densities of Meloidogyne arenaria were obtained in plots inoculated with 0.5 to 50 eggs/100 cm(3) soil than with 100 to 200 eggs/100 cm(3).
- Taxon
- peanutArachis hypogaeae1
- Treatment
- 0.5 to 50 eggs/100 cm(3) soile3
- Interactor
- Meloidogyne arenariaMeloidogyne arenariae1pest
- Outcome
- final densitiese3
- Direction
- highere3
- Value
- 1,171 juveniles [J2]/100 cm(3) soile3
- Qualifier
- 313 J2/100 cm(3) soile3
- Comparator
- 100 to 200 eggs/100 cm(3)e3
Organisms pictured · Representative pictures of the matched species, not figures from the paper.
Verbatim
e1“Microplot experiments were conducted in 1989 and 1990 to determine the relationship between yield of peanut (Arachis hypogaea) and inoculum density ofMeloidogyne arenaria race 1”
e3“In 1989, higher final densities (mean of 1,171 juveniles [J2]/100 cm(3) soil) were obtained in plots inoculated with 0.5 to 50 eggs/100 cm(3) soil than in plots inoculated with 100 to 200 eggs/100 cm(3) (313 J2/100 cm(3) soil)”
Claim · model-written summary
In 1990, final densities of Meloidogyne arenaria reached high levels in all inoculated peanut plots.
- Taxon
- peanutArachis hypogaeae1
- Interactor
- M. arenariaMeloidogyne arenariae4pest
- Outcome
- final densities of M. arenariae4
- Value
- >/= 1,111 J2/100 cm(3) soile4
- Qualifier
- in all inoculated plotse4
Organisms pictured · Representative pictures of the matched species, not figures from the paper.
Verbatim
e1“Microplot experiments were conducted in 1989 and 1990 to determine the relationship between yield of peanut (Arachis hypogaea) and inoculum density ofMeloidogyne arenaria race 1”
e4“In 1990, final densities of M. arenaria reached high levels (>/= 1,111 J2/100 cm(3) soil) in all inoculated plots”
Claim · model-written summary
In 1989, pod weight was related to initial density by Seinhorst's equation with r2 = 0.826.
- Taxon
- peanutArachis hypogaeae1
- Treatment
- initial densitye5
- Outcome
- pod weighte5
- Value
- r(2) = 0.826e5
- Qualifier
- Seinhorst's equatione5
Not reportedDirection
Organisms pictured · Representative pictures of the matched species, not figures from the paper.
Verbatim
e1“Microplot experiments were conducted in 1989 and 1990 to determine the relationship between yield of peanut (Arachis hypogaea) and inoculum density ofMeloidogyne arenaria race 1”
e5“In 1989, the relationship between pod weight (y) and initial density (x) was described by Seinhorst's equation, with y = 0.088 + 0.91(0.90)x(1) and r(2) = 0.826. In 1990, the relationship was y = 0.22 + 0.78(0.97)x(1) and r(2) = 0.794”
Claim · model-written summary
In 1990, pod weight was related to initial density with r2 = 0.794.
- Taxon
- peanutArachis hypogaeae1
- Treatment
- initial densitye5
- Outcome
- pod weighte5
- Value
- r(2) = 0.794e5
Not reportedDirection
Organisms pictured · Representative pictures of the matched species, not figures from the paper.
Verbatim
e1“Microplot experiments were conducted in 1989 and 1990 to determine the relationship between yield of peanut (Arachis hypogaea) and inoculum density ofMeloidogyne arenaria race 1”
e5“In 1989, the relationship between pod weight (y) and initial density (x) was described by Seinhorst's equation, with y = 0.088 + 0.91(0.90)x(1) and r(2) = 0.826. In 1990, the relationship was y = 0.22 + 0.78(0.97)x(1) and r(2) = 0.794”
Claim · model-written summary
The equations suggest tolerance limits of approximately 1 egg/100 cm3 soil for Meloidogyne arenaria.
- Taxon
- peanutArachis hypogaeae1
- Interactor
- Meloidogyne arenariaMeloidogyne arenariae1pest
- Outcome
- tolerance limitse6
- Value
- approximately 1 egg/100 cm(3) soile6
Organisms pictured · Representative pictures of the matched species, not figures from the paper.
Verbatim
e1“Microplot experiments were conducted in 1989 and 1990 to determine the relationship between yield of peanut (Arachis hypogaea) and inoculum density ofMeloidogyne arenaria race 1”
e6“These equations suggest tolerance limits of approximately 1 egg/100 cm(3) soil, which may require specialized methods, such as bioassay, for detection”
Claim · model-written summary
Specialized methods, such as bioassay, may be required to detect the nematode at these low densities.
- Taxon
- peanutArachis hypogaeae1
- Outcome
- detectione6
- Qualifier
- may require specialized methods, such as bioassaye6
Organisms pictured · Representative pictures of the matched species, not figures from the paper.
Verbatim
e1“Microplot experiments were conducted in 1989 and 1990 to determine the relationship between yield of peanut (Arachis hypogaea) and inoculum density ofMeloidogyne arenaria race 1”
e6“These equations suggest tolerance limits of approximately 1 egg/100 cm(3) soil, which may require specialized methods, such as bioassay, for detection”