Abstract
In study of the plant‐animal interface, knowledge of the organic fraction of pasture, esophageal, and fecal samples can help predict energy intake and digestion. Ashing of the large sample volumes necessary to conduct interface studies, however, is cumbersome and impractical. This study was initiated to examine the use of near‐infrared reflectance spectroscopy (NIRS) as a means of predicting ash concentration in pasture, esophageal, and fecal samples. Pasture mixtures of alfalfa ( Medicago sativa L.) and tall fescue ( Festuca arundinacea Schreb.) were defoliated by grazing animals. Pasture, esophageal, and fecal samples were collected and scanned by NIRS. A calibration subset was selected, samples were ashed, and the data used for equation development. The optimum equation was developed using log 1/reflectance ( R ) spectral data and produced standard errors of calibration (SEC) and validation (SEP) of 14.4 and 14.2 g kg −1 , respectively, regardless of whether ash or organic matter data were used. Equations selected during calibration contained three wavelength pairs within 40 nm of one another. New calibration equations were generated by forcing in one wavelength in the neighboring pair ± 20 nm from the selected band. Validation error of calibration equations with forced wavelengths was not different from that of the original calibration equation. It was concluded that wavelength pairs were necessary to calculate slope differences of spectra from samples varying in ash concentration. Recalibration of the instrument with a subset of pasture and esophageal samples unproved SEC and SEP to 9.5 and 9.8 g kg −1 , respectively; recalibration with a subset of fecal samples improved SEC and SEP to 10.6 and 12.7 g kg −1 , respectively.
Abstract from the paper’s OpenAlex record, shown for indexing and research. Copyright remains with the authors or the publisher. Read at the source ↗
The text the model read, with the source record’s inline markup (italics, sub- and superscripts) rendered and its character entities decoded; quote offsets refer to the raw text.
Claims 9
Claim · model-written summary
The optimum NIRS equation gave a calibration error of 14.4 g kg −1.
- Taxon
- alfalfa
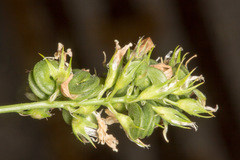 Medicago sativat0
- Outcome
- standard errors of calibratione0
- Value
- 14.4e0
Not reportedComparator
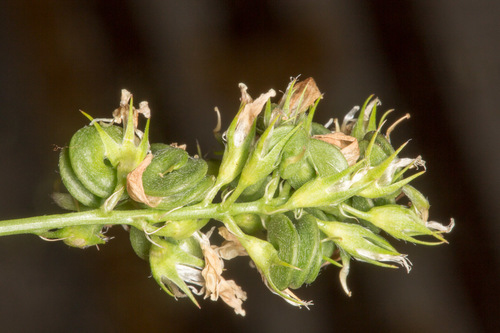
Organisms pictured · Representative pictures of the matched species, not figures from the paper.
Verbatim
e0“standard errors of calibration (SEC) and validation (SEP) of 14.4 and 14.2 g kg −1 , respectively”
t0“Pasture mixtures of alfalfa ( Medicago sativa L.) and tall fescue ( Festuca arundinacea Schreb.)”
Claim · model-written summary
The optimum NIRS equation gave a validation error of 14.2 g kg −1.
- Taxon
- tall fescue
 Lolium arundinaceumt0
- Outcome
- validation (SEP)e0
- Value
- 14.2 g kg −1e0
Not reportedComparator
Organisms pictured · Representative pictures of the matched species, not figures from the paper.

Verbatim
e0“standard errors of calibration (SEC) and validation (SEP) of 14.4 and 14.2 g kg −1 , respectively”
t0“Pasture mixtures of alfalfa ( Medicago sativa L.) and tall fescue ( Festuca arundinacea Schreb.)”
Claim · model-written summary
Selected equations had three wavelength pairs within 40 nm.
- Taxon
- alfalfaMedicago sativat0
- Outcome
- wavelength pairse0
- Value
- threee0
Organisms pictured · Representative pictures of the matched species, not figures from the paper.
Verbatim
e0“Equations selected during calibration contained three wavelength pairs within 40 nm of one another”
t0“Pasture mixtures of alfalfa ( Medicago sativa L.) and tall fescue ( Festuca arundinacea Schreb.)”
Claim · model-written summary
Forced wavelength equations had validation errors no different from the original equation.
- Taxon
- alfalfaMedicago sativat0
- Outcome
- Validation errore0
- Direction
- not differente0
- Comparator
- original calibration equatione0
Organisms pictured · Representative pictures of the matched species, not figures from the paper.
Verbatim
e0“Validation error of calibration equations with forced wavelengths was not different from that of the original calibration equation”
t0“Pasture mixtures of alfalfa ( Medicago sativa L.) and tall fescue ( Festuca arundinacea Schreb.)”
Claim · model-written summary
The authors concluded wavelength pairs were necessary for spectral slope differences.
- Taxon
- alfalfaMedicago sativat0
- Outcome
- wavelength pairs were necessary to calculate slope differencese0
Organisms pictured · Representative pictures of the matched species, not figures from the paper.
Verbatim
e0“wavelength pairs were necessary to calculate slope differences of spectra from samples varying in ash concentration”
t0“Pasture mixtures of alfalfa ( Medicago sativa L.) and tall fescue ( Festuca arundinacea Schreb.)”
Claim · model-written summary
Recalibration with pasture and esophageal samples improved SEC to 9.5 g kg −1.
- Taxon
- alfalfaMedicago sativat0
- Outcome
- SECe0
- Value
- 9.5e0
Not reportedComparator
Organisms pictured · Representative pictures of the matched species, not figures from the paper.
Verbatim
e0“Recalibration of the instrument with a subset of pasture and esophageal samples unproved SEC and SEP to 9.5 and 9.8 g kg −1”
t0“Pasture mixtures of alfalfa ( Medicago sativa L.) and tall fescue ( Festuca arundinacea Schreb.)”
Claim · model-written summary
Recalibration with pasture and esophageal samples improved SEP to 9.8 g kg −1.
- Taxon
- alfalfaMedicago sativat0
- Outcome
- SEPe0
- Value
- 9.8 g kg −1e0
Not reportedComparator
Organisms pictured · Representative pictures of the matched species, not figures from the paper.
Verbatim
e0“Recalibration of the instrument with a subset of pasture and esophageal samples unproved SEC and SEP to 9.5 and 9.8 g kg −1”
t0“Pasture mixtures of alfalfa ( Medicago sativa L.) and tall fescue ( Festuca arundinacea Schreb.)”
Claim · model-written summary
Recalibration with fecal samples improved SEC to 10.6 g kg −1.
- Taxon
- alfalfaMedicago sativat0
- Outcome
- SECe0
- Value
- 10.6e0
Not reportedComparator
Organisms pictured · Representative pictures of the matched species, not figures from the paper.
Verbatim
e0“recalibration with a subset of fecal samples improved SEC and SEP to 10.6 and 12.7 g kg −1”
t0“Pasture mixtures of alfalfa ( Medicago sativa L.) and tall fescue ( Festuca arundinacea Schreb.)”
Claim · model-written summary
Recalibration with fecal samples improved SEP to 12.7 g kg −1.
- Taxon
- alfalfaMedicago sativat0
- Outcome
- SEPe0
- Value
- 12.7 g kg −1e0
Not reportedComparator
Organisms pictured · Representative pictures of the matched species, not figures from the paper.
Verbatim
e0“recalibration with a subset of fecal samples improved SEC and SEP to 10.6 and 12.7 g kg −1”
t0“Pasture mixtures of alfalfa ( Medicago sativa L.) and tall fescue ( Festuca arundinacea Schreb.)”