Abstract
Interference among neighbouring plants, often due to competition for limited resources, is central to subjects such as yield-density relationships, intercropping, self-thinning in dense plant stands and low reproductive yield in certain crops. An experiment was conducted to investigate plant interference in associated populations of beans {Phaseolus vulgaris L.) and beets [Beta vulgaris L.). Plants of the two species were grown at different total densities and at different mixture proportions in a randomized complete block design. Several analytical procedures were used to interpret and define treatment effects. The analysis of variance indicated that yield was significantly reduced with either increasing total population density or increasing bean proportions in mixtures. The interactions of total population density and mixture proportions were only occasionally significant. Parameters of non-linear models used to define yield-density relationships indicated that beans were the superior competitor, both against themselves and against beets. The model parameters were also used to determine differential yield responses on total dry weight, leaf dry weight, leaf number and leaf area in the bean-beet mixtures. Yield advantage was observed in leaf dry weight and leaf number when model parameters were used in calculating land equivalent ratios whereas total dry weight and leaf area showed yield disadvantage. Using observed values to calculate land equivalent ratios indicated yield advantage in all four variables. Plant size inequalities, as determined by the Gini coefficient tended to decrease in beet monocultures with increasing population density. In monocultures of beans and in the bean-beet mixtures, plant size distribution was not systematically changed by density and mixture treatments. Yield component analysis indicated that the variation in total yield due, to either population density or mixture treatments increased with age; the variation due to the population density by mixture proportions Interaction remained relatively constant throughout the growing season. Leaf number per plant was the yield component which was most frequently a significant source of yield variation both in the forward and backward yield component analysis. Plant growth analysis indicated that leaf area ratio and specific leaf weight were higher at higher population densities and at higher bean proportions. Harvest index decreased with increasing population density and with increasing proportions of the competing species in beets. Absolute growth, relative growth and unit leaf rates increased with time and declined after reaching a peak at about 68 days after planting. Both the lowest population density of 16 plants m ̄² and the mixture treatment with the least proportion of beans had the greatest increase in absolute growth, relative growth and unit leaf rates. Allometric relationships between total plant dry weight and any secondary measure per plant were influenced in different ways by density and mixture treatments and by time of harvest. The composition of models also varied considerably. The interpretation of plant interference, therefore is strongly influenced by the choice of plant characteristics which are measured, and by the time of measurement.
Abstract from the paper’s OpenAlex record, shown for indexing and research. Copyright remains with the authors or the publisher. Read at the source ↗
The text the model read, with the source record’s inline markup (italics, sub- and superscripts) rendered and its character entities decoded; quote offsets refer to the raw text.
Claims 18
Claim · model-written summary
Increasing total population density significantly reduced yield in the bean-beet experiment.
- Taxon
- Phaseolus vulgaris
 Phaseolus vulgarist0
- Treatment
- increasing total population densitye0
- Outcome
- yielde0
- Direction
- reducede0
Not reportedComparator
Organisms pictured · Representative pictures of the matched species, not figures from the paper.

Verbatim
t0“Beans (Phaseolus vulgaris L.) and Beets (Beta vulgaris L.)”
e0“yield was significantly reduced with either increasing total population density or increasing bean proportions in mixtures”
Claim · model-written summary
Increasing bean proportion in mixtures significantly reduced yield.
- Taxon
- Phaseolus vulgarisPhaseolus vulgarist0
- Treatment
- increasing bean proportions in mixturese0
- Outcome
- yielde0
- Direction
- reducede0
Not reportedComparator
Organisms pictured · Representative pictures of the matched species, not figures from the paper.
Verbatim
t0“Beans (Phaseolus vulgaris L.) and Beets (Beta vulgaris L.)”
e0“yield was significantly reduced with either increasing total population density or increasing bean proportions in mixtures”
Claim · model-written summary
The interaction of total population density and mixture proportions was significant only occasionally.
- Taxon
- Phaseolus vulgarisPhaseolus vulgarist0
- Treatment
- total population density and mixture proportionse1
- Outcome
- interactions of total population density and mixture proportionse1
- Qualifier
- only occasionallye1
Not reportedDirection
Organisms pictured · Representative pictures of the matched species, not figures from the paper.
Verbatim
t0“Beans (Phaseolus vulgaris L.) and Beets (Beta vulgaris L.)”
e1“The interactions of total population density and mixture proportions were only occasionally significant”
Claim · model-written summary
Beans were the superior competitor, both against themselves and against beets, according to non-linear model parameters.
- Taxon
- Phaseolus vulgarisPhaseolus vulgarist0
- Interactor
- beets
 Beta vulgarise2other
- Outcome
- superior competitore2
- Direction
- superiore2
- Qualifier
- against themselvese2
- Comparator
- beetse2
Organisms pictured · Representative pictures of the matched species, not figures from the paper.
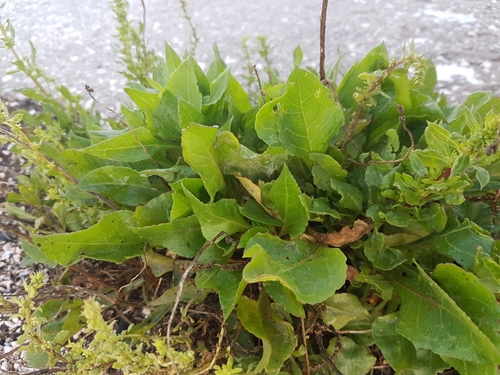
Verbatim
t0“Beans (Phaseolus vulgaris L.) and Beets (Beta vulgaris L.)”
e2“beans were the superior competitor, both against themselves and against beets”
Claim · model-written summary
Land equivalent ratios from observed values showed yield advantage in total dry weight, leaf dry weight and leaf number in the bean-beet mixtures.
- Taxon
- Phaseolus vulgarisPhaseolus vulgarist0
- Treatment
- bean-beet mixturese1
- Outcome
- total dry weight, leaf dry weight, leaf numbere1
- Direction
- yield advantagee0
- Qualifier
- Using observed values to calculate land equivalent ratiose0
Organisms pictured · Representative pictures of the matched species, not figures from the paper.
Verbatim
t0“Beans (Phaseolus vulgaris L.) and Beets (Beta vulgaris L.)”
e0“Using observed values to calculate land equivalent ratios indicated yield advantage in all four variables”
e1“total dry weight, leaf dry weight, leaf number and leaf area in the bean-beet mixtures”
Claim · model-written summary
Land equivalent ratios from observed values showed yield advantage in leaf area in the bean-beet mixtures.
- Taxon
- Phaseolus vulgarisPhaseolus vulgarist0
- Treatment
- bean-beet mixturese1
- Outcome
- leaf areae1
- Direction
- yield advantagee0
- Qualifier
- Using observed values to calculate land equivalent ratiose0
Organisms pictured · Representative pictures of the matched species, not figures from the paper.
Verbatim
t0“Beans (Phaseolus vulgaris L.) and Beets (Beta vulgaris L.)”
e0“Using observed values to calculate land equivalent ratios indicated yield advantage in all four variables”
e1“total dry weight, leaf dry weight, leaf number and leaf area in the bean-beet mixtures”
Claim · model-written summary
The Gini coefficient of plant size inequality tended to decrease with increasing population density in beet monocultures.
- Taxon
- Beta vulgarisBeta vulgarist0
- Treatment
- increasing population densitye0
- Outcome
- Plant size inequalitiese0
- Direction
- decreasee0
- Qualifier
- tended toe0
Organisms pictured · Representative pictures of the matched species, not figures from the paper.
Verbatim
t0“Beans (Phaseolus vulgaris L.) and Beets (Beta vulgaris L.)”
e0“Plant size inequalities, as determined by the Gini coefficient tended to decrease in beet monocultures with increasing population density”
Claim · model-written summary
Plant size distribution was not systematically changed by density and mixture treatments in bean monocultures and in bean-beet mixtures.
- Taxon
- Phaseolus vulgarisPhaseolus vulgarist0
- Treatment
- density and mixture treatmentse0
- Outcome
- plant size distributione0
- Direction
- not systematically changede0
Organisms pictured · Representative pictures of the matched species, not figures from the paper.
Verbatim
t0“Beans (Phaseolus vulgaris L.) and Beets (Beta vulgaris L.)”
e0“In monocultures of beans and in the bean-beet mixtures, plant size distribution was not systematically changed by density and mixture treatments”
Claim · model-written summary
The variation in total yield due to population density or mixture treatments increased with age.
- Taxon
- Phaseolus vulgarisPhaseolus vulgarist0
- Treatment
- population density or mixture treatmentse0
- Outcome
- variation in total yielde0
- Direction
- increasede0
- Qualifier
- with agee0
Organisms pictured · Representative pictures of the matched species, not figures from the paper.
Verbatim
t0“Beans (Phaseolus vulgaris L.) and Beets (Beta vulgaris L.)”
e0“the variation in total yield due, to either population density or mixture treatments increased with age”
Claim · model-written summary
The variation due to the population density by mixture proportions interaction remained relatively constant through the growing season.
- Taxon
- Phaseolus vulgarisPhaseolus vulgarist0
- Treatment
- population density by mixture proportionse0
- Outcome
- variation due to the population density by mixture proportions Interactione0
- Direction
- remained relatively constante0
- Qualifier
- throughout the growing seasone0
Organisms pictured · Representative pictures of the matched species, not figures from the paper.
Verbatim
t0“Beans (Phaseolus vulgaris L.) and Beets (Beta vulgaris L.)”
e0“the variation due to the population density by mixture proportions Interaction remained relatively constant throughout the growing season”
Claim · model-written summary
Leaf number per plant was the yield component most frequently a significant source of yield variation.
- Taxon
- Phaseolus vulgarisPhaseolus vulgarist0
- Outcome
- Leaf number per plante0
- Qualifier
- most frequently a significant source of yield variatione0
Organisms pictured · Representative pictures of the matched species, not figures from the paper.
Verbatim
t0“Beans (Phaseolus vulgaris L.) and Beets (Beta vulgaris L.)”
e0“Leaf number per plant was the yield component which was most frequently a significant source of yield variation”
Claim · model-written summary
Leaf area ratio and specific leaf weight were higher at higher population densities and at higher bean proportions.
- Taxon
- Phaseolus vulgarisPhaseolus vulgarist0
- Treatment
- higher population densities and at higher bean proportionse0
- Outcome
- leaf area ratio and specific leaf weighte0
- Direction
- highere0
Organisms pictured · Representative pictures of the matched species, not figures from the paper.
Verbatim
t0“Beans (Phaseolus vulgaris L.) and Beets (Beta vulgaris L.)”
e0“leaf area ratio and specific leaf weight were higher at higher population densities and at higher bean proportions”
Claim · model-written summary
Harvest index decreased with increasing population density and with increasing proportion of beets.
- Taxon
- Phaseolus vulgarisPhaseolus vulgarist0
- Treatment
- increasing population densitye0
- Interactor
- beetsBeta vulgarise0other
- Outcome
- Harvest indexe0
- Direction
- decreasede0
Organisms pictured · Representative pictures of the matched species, not figures from the paper.
Verbatim
t0“Beans (Phaseolus vulgaris L.) and Beets (Beta vulgaris L.)”
e0“Harvest index decreased with increasing population density and with increasing proportions of the competing species in beets”
Claim · model-written summary
Absolute growth, relative growth and unit leaf rates increased with time.
- Taxon
- Phaseolus vulgarisPhaseolus vulgarist0
- Outcome
- Absolute growth, relative growth and unit leaf ratese0
- Direction
- increasede0
Organisms pictured · Representative pictures of the matched species, not figures from the paper.
Verbatim
t0“Beans (Phaseolus vulgaris L.) and Beets (Beta vulgaris L.)”
e0“Absolute growth, relative growth and unit leaf rates increased with time and declined after reaching a peak at about 68 days after planting”
Claim · model-written summary
Absolute growth, relative growth and unit leaf rates declined after a peak at about 68 days after planting.
- Taxon
- Phaseolus vulgarisPhaseolus vulgarist0
- Outcome
- Absolute growth, relative growth and unit leaf ratese0
- Direction
- declinede0
- Qualifier
- after reaching a peak at about 68 days after plantinge0
Organisms pictured · Representative pictures of the matched species, not figures from the paper.
Verbatim
t0“Beans (Phaseolus vulgaris L.) and Beets (Beta vulgaris L.)”
e0“Absolute growth, relative growth and unit leaf rates increased with time and declined after reaching a peak at about 68 days after planting”
Claim · model-written summary
The lowest population density of 16 plants had the greatest increase in absolute growth, relative growth and unit leaf rates.
- Taxon
- Phaseolus vulgarisPhaseolus vulgarist0
- Treatment
- lowest population density of 16 plantse0
- Outcome
- absolute growth, relative growth and unit leaf ratese1
- Direction
- greatest increasee1
Not reportedComparator
Organisms pictured · Representative pictures of the matched species, not figures from the paper.
Verbatim
t0“Beans (Phaseolus vulgaris L.) and Beets (Beta vulgaris L.)”
e0“Both the lowest population density of 16 plants”
e1“had the greatest increase in absolute growth, relative growth and unit leaf rates”
Claim · model-written summary
The mixture treatment with the least proportion of beans had the greatest increase in absolute growth, relative growth and unit leaf rates.
- Taxon
- Phaseolus vulgarisPhaseolus vulgarist0
- Treatment
- the mixture treatment with the least proportion of beanse0
- Outcome
- absolute growth, relative growth and unit leaf ratese1
- Direction
- greatest increasee1
Not reportedComparator
Organisms pictured · Representative pictures of the matched species, not figures from the paper.
Verbatim
t0“Beans (Phaseolus vulgaris L.) and Beets (Beta vulgaris L.)”
e0“the mixture treatment with the least proportion of beans”
e1“had the greatest increase in absolute growth, relative growth and unit leaf rates”
Claim · model-written summary
Allometric relationships between total plant dry weight and secondary measures were influenced in different ways by density, mixture treatments and time of harvest.
- Taxon
- Phaseolus vulgarisPhaseolus vulgarist0
- Treatment
- density and mixture treatmentse0
- Outcome
- Allometric relationships between total plant dry weight and any secondary measure per plante0
- Qualifier
- by time of harveste0
Not reportedDirection
Organisms pictured · Representative pictures of the matched species, not figures from the paper.
Verbatim
t0“Beans (Phaseolus vulgaris L.) and Beets (Beta vulgaris L.)”
e0“Allometric relationships between total plant dry weight and any secondary measure per plant were influenced in different ways by density and mixture treatments and by time of harvest”