View: List Claim type Research area Organism Taxon as written Decade Paper Method / resource observed original result measured Claim · model-written summary
Assay standard deviations were low at both ethanol concentrations.
Assay standard deviations e0 both ethanol concentrations e0 Verbatim
t0 “Alfalfa ”
✓ located verbatim in the source · title, characters 105–112 e0 “Assay standard deviations were low for both ethanol concentrations. ”
✓ located verbatim in the source · abstract, characters 884–951 Other claims from this paper (8) Method / resource observed original result measured Claim · model-written summary
Relative standard deviations were below 10% in the shallot assay .
relative standard deviations e0 Not reported Taxon
Verbatim
e0 “relative standard deviations are less than 10% ”
✓ located verbatim in the source · abstract, characters 297–343 Other claims from this paper (2) Method / resource observed original result measured Claim · model-written summary
Aflatoxin assay relative standard deviations were below 8.2%.
relative standard deviations e0 Verbatim
t0 “Aflatoxin Contents in Peanuts ”
✓ located verbatim in the source · title, characters 49–78 e0 “the relative standard deviations were less than 8.2% ”
✓ located verbatim in the source · abstract, characters 496–548 Other claims from this paper (6) Method / resource observed original result measured Claim · model-written summary
The assay had relative standard deviations below 8.0%.
relative standard deviations e0 Verbatim
e0 “relative standard deviations < 8.0% ”
✓ located verbatim in the source · abstract, characters 410–445 t0 “cabbage ”
✓ located verbatim in the source · title, characters 80–87 Other claims from this paper (5) Method / resource observed original result measured Claim · model-written summary
The residue assay had relative standard deviations of 2.1–9.5%.
relative standard deviations e0 Verbatim
e0 “the relative standard deviations (RSDs) were 2.1–9.5% ”
✓ located verbatim in the source · abstract, characters 434–487 Other claims from this paper (11) Method / resource observed original result positive measured Claim · model-written summary
Assay relative standard deviations were less than 3%.
Verbatim
e0 “RSDs were less than 3% ”
✓ located verbatim in the source · abstract, characters 1029–1051 e1 “cannabis assay ”
✓ located verbatim in the source · abstract, characters 35–49 Other claims from this paper (3) Method / resource observed original result positive measured Claim · model-written summary
HPLC assay relative standard deviations ranged from 0.87% to 2.2%.
Lithhocarpus polgstachrch Rehd t0 relative standard deviations e0 Verbatim
e0 “The recoveries of the flavonoid are 97%~103%, and relative standard deviations are 0.87%~2.2%. ”
✓ located verbatim in the source · abstract, characters 543–637 t0 “Lithhocarpus polgstachrch Rehd ”
✓ located verbatim in the source · title, characters 28–58 Other claims from this paper (1) Method / resource observed original result measured Claim · model-written summary
Relative standard deviations of the chloropicrin assay were 1.9%~7.2%.
Vegetables and Fruits t0 relative standard deviations(RSD) e0 Verbatim
e0 “with relative standard deviations (RSD) of 1.9%~7.2% ”
✓ located verbatim in the source · abstract, characters 425–476 t0 “Vegetables and Fruits ”
✓ located verbatim in the source · title, characters 48–69 Other claims from this paper (9) Method / resource observed original result measured Claim · model-written summary
Assay relative standard deviations ranged from 2% to 31 11%.
relative standard deviations (RSDs) e0 Verbatim
e0 “the relative standard deviations (RSDs) ranged from 2% to 31 11%. ”
✓ located verbatim in the source · abstract, characters 762–827 t0 “soybean ( Glycine max (L.) Merr.) ”
✓ located verbatim in the source · title, characters 54–87 Other claims from this paper (4) Method / resource observed original result measured Claim · model-written summary
Relative standard deviations for the fruit assay were 1.3–7.9%.
relative standard deviations (RSDs) e0 Verbatim
e0 “relative standard deviations (RSDs) were 1.3–7.9% ”
✓ located verbatim in the source · abstract, characters 871–920 t0 “fruits ”
✓ located verbatim in the source · title, characters 19–25 Other claims from this paper (4) Lexical search (BM25). All words must match; if nothing does, any word. Organism names also match every spelling of the same organism. No semantic search yet.
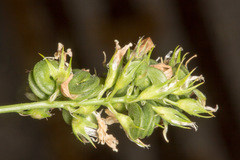 Medicago sativat0
 Arachis hypogaea
 Brassica oleracea var. capitata
 Cannabis
 Glycine max