View: List Claim type Research area Organism Taxon as written Decade Paper Mechanism hypothesis original result measured Claim · model-written summary
The variability in flavonoid detection may reflect genetic variability between populations .
genetic variability between populations e4 Verbatim
t0 “Flavonoid components of Dicentra canadensis ”
✓ located verbatim in the source · title, characters 0–43 e4 “This variability may reflect some genetic variability between populations ”
✓ located verbatim in the source · abstract, characters 674–747 Other claims from this paper (4) Observation observed original result measured Claim · model-written summary
Variability between populations was high.
variability between populations e0 Verbatim
e0 “variability between populations was high ”
✓ located verbatim in the source · abstract, characters 1622–1662 t0 “Lolium perenne L.
✓ located verbatim in the source · title, characters 68–85 Other claims from this paper (6) Observation observed original result measured Claim · model-written summary
Selected populations had genetic variability between nonselected populations and commercial varieties.
selected populations e0 genetic variability e0 midway between e0 commercial varieties e0 nonselected populations e0 Verbatim
e0 “genetic variability in the selected populations was midway between that of the nonselected populations and that of the commercial varieties monitored ”
✓ located verbatim in the source · abstract, characters 790–939 t0 “cotton populations ”
✓ located verbatim in the source · title, characters 95–113 Other claims from this paper (2) Observation observed original result measured Claim · model-written summary
Epilobium minutiflorum populations show a moderate genetic variability between populations .
genetic variability between E. minutiflorum populations e1 Verbatim
t0 “Population genetic study in Epilobium minutiflorum (Onagraceae) in Iran ”
✓ located verbatim in the source · title, characters 0–71 e1 “Genetic diversity analyses revealed a moderate genetic variability between E. minutiflorum populations ”
✓ located verbatim in the source · abstract, characters 584–686 Other claims from this paper (5) Observation observed original result measured Claim · model-written summary
Genetic variability was greatest within populations and least between populations .
genetic variability within the population e0 between populations e0 Verbatim
e0 “The genetic variability within the population was found to be the highest, while variation between populations was the lowest ”
✓ located verbatim in the source · abstract, characters 860–985 t0 “common bean ”
✓ located verbatim in the source · title, characters 30–41 Other claims from this paper (9) Observation observed original result measured Claim · model-written summary
27.14% of the variability is found between populations .
the variability is found between populations e2 Verbatim
t0 “Anacardium humile A. ST-HIL
✓ located verbatim in the source · title, characters 50–77 e2 “27.14% of the variability is found between populations and 37.44% within the populations ”
✓ located verbatim in the source · abstract, characters 507–595 Other claims from this paper (6) Observation observed original result measured Claim · model-written summary
AMOVA assigned 23% of total variability between populations .
Palicourea coriacea t0 total variability was between populations e0 Verbatim
e0 “Analysis by AMOVA revealed that 23% of the total variability was between populations and 77% was within populations . ”
✓ located verbatim in the source · abstract, characters 544–660 t0 “Palicourea coriacea ”
✓ located verbatim in the source · title, characters 71–90 Other claims from this paper (9) Observation observed original result measured Claim · model-written summary
The first discriminant function accounted for 63% of the variability between populations of Quercus robur .
variability between populations e5 first discriminant function e5 Verbatim
e0 “leaf morphological variability of Quercus robur L. ”
✓ located verbatim in the source · abstract, characters 56–106 e5 “the first discriminant function accounted for 63% of the variability between populations ”
✓ located verbatim in the source · abstract, characters 778–866 Other claims from this paper (7) Observation observed original result measured Claim · model-written summary
Thirty percent of genetic variability lay between populations .
genetic variability e0 Not reported Taxon
Verbatim
e0 “30% of the genetic variability between populations ”
✓ located verbatim in the source · abstract, characters 3244–3294 Other claims from this paper (12) Observation observed original result measured Claim · model-written summary
The remaining genetic variability of Satureja kitaibelii lies between populations .
between populations e4 Verbatim
e0 “Satureja kitaibelii Wierzb. ex Heuff. (Lamiaceae) is an endemic species
✓ located verbatim in the source · abstract, characters 0–71 e4 “Genetic analysis using ISSR markers showed that most variability lies within the populations (75.9 %), whereas the rest was between populations ”
✓ located verbatim in the source · abstract, characters 907–1050 Other claims from this paper (8) Lexical search (BM25). All words must match; if nothing does, any word. Organism names also match every spelling of the same organism. No semantic search yet.
 Dicentra canadensist0
 Lolium perenne
 Gossypium hirsutum
 Phaseolus vulgaris
 Anacardium humile
 Quercus robur
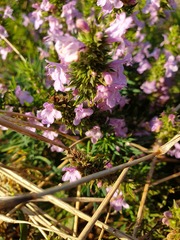 Satureja kitaibelii