Abstract
Little work has been done to assess the impact of elevated CO 2 on responses of forages to defoliation. This study examines regrowth, biomass partitioning, and labile C and N metabolites in three functional plant‐types: a C 3 grass [ Pascopyrum smithii (Rydb.) A. Love], a C 4 grass [ Bouteloua gracilis (H.B.K.) Lag.], and a forage legume ( Medicago sativa L.). Plants were grown from seed, defoliated twice, and grown in a controlled environment under a factorial arrangement of two CO 2 [low CO 2 (LC), 355 μmol mol −1 , and high CO 2 (HC), 700 μmol mol −1 ] and two N nutrition regimes [low N (LN), watered twice weekly with half‐strength Hoagland's containing 0 N, and high N (HN), half‐strength Hoagland's containing 14 m M N]. High N enhanced regrowth in all three species, while high CO 2 enhanced regrowth only in the two C 3 species. In M. sativa , CO 2 and N treatments had no significant effect on k , the allometric growth coefficient. In contrast, k was reduced in P. smithii plants grown under LN (0.63) compared with HN (0.99). In B. gracilis , low N also reduced k , but it interacted with CO 2 so that k was greatest for plants grown at HN/HC (0.95) and HN/LC (0.89), intermediate at LN/LC (0.58), and least at LN/HC (0.44). These results indicate greater partitioning to below‐ground organs (reduced k ) when N is limiting, particularly under elevated CO 2 Significant correlations were established between k and several measures of plant N status, suggesting that the effects of CO 2 on plant biomass partitioning involve N status.
Abstract from the paper’s OpenAlex record, shown for indexing and research. Copyright remains with the authors or the publisher. Read at the source ↗
The text the model read, with the source record’s inline markup (italics, sub- and superscripts) rendered and its character entities decoded; quote offsets refer to the raw text.
Claims 10
Claim · model-written summary
High nitrogen enhanced regrowth in all three forage species.
- Taxon
- Pascopyrum smithii
 Pascopyrum smithiie1
- Treatment
- High Ne0
- Outcome
- regrowthe0
- Direction
- enhancede0
- Qualifier
- all three speciese0
Not reportedComparator
Organisms pictured · Representative pictures of the matched species, not figures from the paper.

Verbatim
e0“High N enhanced regrowth in all three species”
e1“Pascopyrum smithii (Rydb.) A. Love], a C 4 grass [ Bouteloua gracilis (H.B.K.) Lag.], and a forage legume ( Medicago sativa L.”
Claim · model-written summary
High carbon dioxide enhanced regrowth in the two C3 species.
- Taxon
- Pascopyrum smithiiPascopyrum smithiie1
- Treatment
- high CO 2e0
- Outcome
- regrowthe0
- Direction
- enhancede0
- Qualifier
- two C 3 speciese0
Not reportedComparator
Organisms pictured · Representative pictures of the matched species, not figures from the paper.
Verbatim
e0“high CO 2 enhanced regrowth only in the two C 3 species.”
e1“Pascopyrum smithii (Rydb.) A. Love], a C 4 grass [ Bouteloua gracilis (H.B.K.) Lag.], and a forage legume ( Medicago sativa L.”
Claim · model-written summary
CO2 and nitrogen had no significant effect on the allometric growth coefficient of Medicago sativa.
- Taxon
- M. sativa
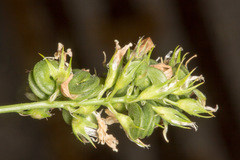 Medicago sativae0
- Treatment
- CO 2 and N treatmentse0
- Outcome
- k , the allometric growth coefficiente0
- Direction
- no significant effecte0
Not reportedComparator
Organisms pictured · Representative pictures of the matched species, not figures from the paper.
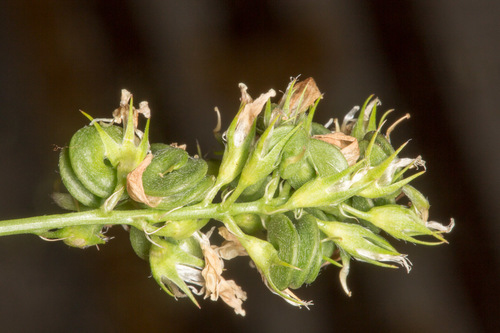
Verbatim
e0“In M. sativa , CO 2 and N treatments had no significant effect on k , the allometric growth coefficient.”
Claim · model-written summary
Low nitrogen reduced the allometric growth coefficient in Pascopyrum smithii from 0.99 to 0.63.
- Taxon
- P. smithiiPascopyrum smithiie0
- Treatment
- LNe0
- Outcome
- ke0
- Direction
- reducede0
- Value
- 0.63e0
- Qualifier
- 0.99e0
- Comparator
- HNe0
Organisms pictured · Representative pictures of the matched species, not figures from the paper.
Verbatim
e0“k was reduced in P. smithii plants grown under LN (0.63) compared with HN (0.99).”
Claim · model-written summary
Low nitrogen reduced the allometric growth coefficient in Bouteloua gracilis.
- Taxon
- B. gracilis
 Bouteloua gracilise0
- Treatment
- low Ne0
- Outcome
- ke0
- Direction
- reducede0
Not reportedComparator
Organisms pictured · Representative pictures of the matched species, not figures from the paper.

Verbatim
e0“In B. gracilis , low N also reduced k , but it interacted with CO 2 so that k was greatest for plants grown at HN/HC (0.95) and HN/LC (0.89), intermediate at LN/LC (0.58), and least at LN/HC (0.44).”
Claim · model-written summary
The allometric growth coefficient of Bouteloua gracilis was greatest under high nitrogen and high CO2, at 0.95.
Organisms pictured · Representative pictures of the matched species, not figures from the paper.
Verbatim
e0“k was greatest for plants grown at HN/HC (0.95) and HN/LC (0.89), intermediate at LN/LC (0.58), and least at LN/HC (0.44).”
e1“In B. gracilis , low N also reduced k”
Claim · model-written summary
The allometric growth coefficient of Bouteloua gracilis under high nitrogen and low CO2 was 0.89.
- Taxon
- B. gracilisBouteloua gracilise1
- Treatment
- HN/LCe0
- Outcome
- ke0
- Value
- 0.89e0
Organisms pictured · Representative pictures of the matched species, not figures from the paper.
Verbatim
e0“k was greatest for plants grown at HN/HC (0.95) and HN/LC (0.89), intermediate at LN/LC (0.58), and least at LN/HC (0.44).”
e1“In B. gracilis , low N also reduced k”
Claim · model-written summary
The allometric growth coefficient of Bouteloua gracilis was intermediate under low nitrogen and low CO2, at 0.58.
Organisms pictured · Representative pictures of the matched species, not figures from the paper.
Verbatim
e0“k was greatest for plants grown at HN/HC (0.95) and HN/LC (0.89), intermediate at LN/LC (0.58), and least at LN/HC (0.44).”
e1“In B. gracilis , low N also reduced k”
Claim · model-written summary
The allometric growth coefficient of Bouteloua gracilis was lowest under low nitrogen and high CO2, at 0.44.
Organisms pictured · Representative pictures of the matched species, not figures from the paper.
Verbatim
e0“k was greatest for plants grown at HN/HC (0.95) and HN/LC (0.89), intermediate at LN/LC (0.58), and least at LN/HC (0.44).”
e1“In B. gracilis , low N also reduced k”
Claim · model-written summary
The allometric coefficient correlated significantly with several measures of plant nitrogen status.
- Taxon
- Pascopyrum smithiiPascopyrum smithiie1
- Compound
- Ne0
- Outcome
- ke0
Not reportedDirection
Organisms pictured · Representative pictures of the matched species, not figures from the paper.
Verbatim
e0“Significant correlations were established between k and several measures of plant N status”
e1“Pascopyrum smithii (Rydb.) A. Love], a C 4 grass [ Bouteloua gracilis (H.B.K.) Lag.], and a forage legume ( Medicago sativa L.”
The same questions in other papers
nitrogen · growth · Medicago sativa (alfalfa)Results differ
7 papers in the same direction as this paper · 32 in the opposite direction
- positive
- positive
- positive
36 papers more in this group
See all 40 papers →co2 · growth · Medicago sativa (alfalfa)Positive and negative results
4 papers in the same direction as this paper · 15 in the opposite direction
- positive
- positive
- positive
16 papers more in this group
See all 20 papers →co2 · growth · Pascopyrum smithiiResults agree
1 paper in the same direction as this paper
- positive
nitrogen · growth · Pascopyrum smithiiResults agree
1 paper in the same direction as this paper
- positive
Claims are grouped by organism, treatment and what was measured or targeted. A paper counts as positive when any of its claims in the group is positive.