View: List Claim type Research area Organism Taxon as written Decade Paper Association observed original result positive measured Claim · model-written summary
Crop yield was 50–75% greater in green zones than other zones .
the other zones e0 Not reported Taxon
Verbatim
e0 “The crop yield is also 50–75% greater in green zones than in the other zones ”
✓ located verbatim in the source · abstract, characters 1093–1169 Other claims from this paper (4) Association observed original result significant (as stated) measured Claim · model-written summary
Low yield , harvest or production zones had significantly lower mean disease economic losses than high zones .
mean economic losses due to diseases e0 high yield/harvest/production zones e0 Low yield/harvest/production zones e0 Verbatim
e0 “Low yield /harvest/production zones had significantly lower mean economic losses due to diseases in comparison to high yield /harvest/production zones . ”
✓ located verbatim in the source · abstract, characters 1481–1630 t0 “Soybean ”
✓ located after whitespace/quote normalisation · title, characters 34–41 Other claims from this paper (19) Observation observed original result measured Claim · model-written summary
Unstable yield zones occupied almost 47% of cropland.
unstable yield zones e0 Not reported Taxon
Verbatim
e0 “unstable yield zones comprised almost 47% ”
✓ located verbatim in the source · abstract, characters 513–554 Other claims from this paper (5) Association observed original result significant (as stated) measured Claim · model-written summary
Low stable yield zones had lower normalized SOC than high stable and unstable zones .
Low and stable (LS) yield zones e0 high and stable (HS) and unstable (US) yield zones e0 Verbatim
e0 “Low and stable (LS) yield zones were statistically lower in normalized SOC when compared to high and stable (HS) and unstable (US) yield zones ”
✓ located verbatim in the source · abstract, characters 1628–1770 t0 “crop yield s ”
✓ located verbatim in the source · title, characters 31–42 Other claims from this paper (5) Method / resource observed original result positive simulated Claim · model-written summary
The N prescription enhances zones with high yield potentials while preventing over-fertilization at zones with low yield potentials.
prevents over-fertilization at zones with low yield potentials e2 Not reported Comparator
Verbatim
e1 “N sidedress prescription tool for the US rainfed maize system ”
✓ located verbatim in the source · abstract, characters 2732–2793 e2 “The prescription enhances zones with high yield potentials, while prevents over-fertilization at zones with low yield potentials ”
✓ located verbatim in the source · abstract, characters 3022–3150 Other claims from this paper (7) Recommendation author interpretation original result basis n/a Claim · model-written summary
Yield data can be used to delineate zones for variable management.
delineate zones for variable management e4 Verbatim
t0 “crop yield zones on hummocky terrain ”
✓ located verbatim in the source · title, characters 66–102 e4 “Yield data can be used to delineate zones for variable management ”
✓ located verbatim in the source · abstract, characters 1686–1751 Other claims from this paper (3) Observation observed original result no effect not significant (as stated) measured Claim · model-written summary
Weeded zones had no significant yield losses.
Not reported Taxon
Verbatim
e0 “Yield losses were not significant in weeded zones ”
✓ located verbatim in the source · abstract, characters 516–565 Other claims from this paper (4) Method / resource observed original result positive measured Claim · model-written summary
NDVI derived zones differentiated grape maturity and quality more effectively than yield map zones .
differentiate grape maturity and quality variables e0 more effective e0 zones derived from the yield maps e0 Not reported Taxon
Verbatim
e0 “the zones derived from the NDVI maps are more effective to differentiate grape maturity and quality variables than the zones derived from the yield maps ”
✓ located verbatim in the source · abstract, characters 1192–1344 Other claims from this paper (1) Association observed original result significant (as stated) measured Claim · model-written summary
Low altitude zones had greater root yield than mid altitude zones .
mid (8.5 t/ha) altitude zones e0 low altitude zones e0 Verbatim
e0 “It was significantly (P 0.05) higher (13.6 t/ha) in the low altitude zones than in the mid (8.5 t/ha) altitude zones . ”
✓ located verbatim in the source · abstract, characters 1139–1258 t0 “cassava ”
✓ located verbatim in the source · title, characters 39–46 e1 “The overall mean root yield ”
✓ located verbatim in the source · abstract, characters 968–995 Other claims from this paper (14) Method / resource observed original result measured Claim · model-written summary
Three NDVI zones better represented yield variability.
yield variability e0 three NDVI-based zones e0 Verbatim
e0 “three NDVI-based zones better represented yield variability ”
✓ located verbatim in the source · abstract, characters 1030–1089 t0 “crop ”
✓ located verbatim in the source · title, characters 129–133 Other claims from this paper (3) Lexical search (BM25). All words must match; if nothing does, any word. Organism names also match every spelling of the same organism. No semantic search yet.
 Glycine max
 Zea mays
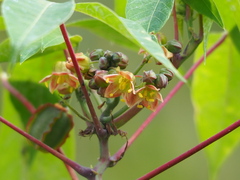 Manihot esculenta