Abstract
Abstract Because N, P, and S fertilizers may be important in the production of high quality alfalfa ( Medicago media Pers.) herbage in northern Saskatchewan, concentration of these elements in herbage was measured from experiments with N, P, and S fertilizers applied to alfalfa plots over an extended time period. Nitrogen rates at 10, 45, and 67 kg N ha −1 were applied in combination with 0, 22, and 45 kg S ha −1 . Twenty kilograms P ha −1 was applied with these treatments. Other treatments were 10, 0, 0; 10, 10, 0; 22, 0, 26; and 0, 0, 0 (Control); N, P, S ha −1 rates, respectively. In general, first cut alfalfa herbage was lower in protein‐N than the second cut with the exception of 1 year. The lowest N concentration per cut was 33.4 g kg −1 averaged over the life of the stand at the Whitefox site (Wf fsl, Whitefox fine sandy loam, Typic Cryoboralf). The highest N concentration in herbage per cut was 39.7 g kg −1 at the Waitville site (Wv 1, Waitville loam, Typic Cryoboralf). Only at the Wv 1 site, and only with S fertilizer, was N concentration consistently increased every year (after establishment year). The percentage of applied N recovered in the alfalfa ranged from 48 to 95%. Approximately 14 kg S ha −1 per year (two cuts) was removed by herbage when fertilized at 22 kg S ha −1 at the Wv 1 site. At a fertilizer rate of 45 kg S ha −1 , uptake of P per year (two cuts) was approximately 19.0 kg P ha −1 . The lowest yield of N was 78 kg N ha −1 per cut at the Wv 1 site averaged over the life of the stand. The highest uptake was 128 kg N ha −1 per cut at the Melfort soil site (M sic, Melfort silty clay, Typic Cryoboroll). A range of 14:1 to 21:1 of the N to S ratio in herbage was the limit indicated for a S deficiency in the alfalfa crop. Plant testing could be used in conjunction with the soil test for S in making fertilizer recommendations.
Abstract from the paper’s OpenAlex record, shown for indexing and research. Copyright remains with the authors or the publisher. Read at the source ↗
The text the model read, with the source record’s inline markup (italics, sub- and superscripts) rendered and its character entities decoded; quote offsets refer to the raw text.
Claims 11
Claim · model-written summary
First cut alfalfa herbage generally had lower protein nitrogen than second cut herbage, except in one year.
- Taxon
- alfalfa
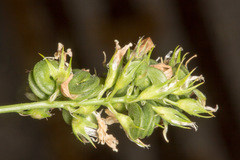 Medicago sativae0
- Outcome
- protein‐Ne0
- Direction
- lowere0
- Qualifier
- with the exception of 1 yeare0
- Comparator
- second cute0
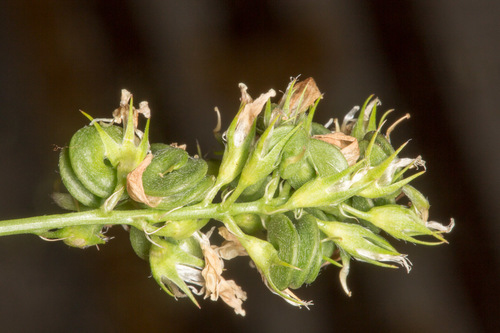
Organisms pictured · Representative pictures of the matched species, not figures from the paper.
Verbatim
e0“In general, first cut alfalfa herbage was lower in protein‐N than the second cut with the exception of 1 year.”
Claim · model-written summary
The lowest nitrogen concentration per cut was 33.4 g kg −1 at Whitefox.
- Taxon
- AlfalfaMedicago sativat0
- Outcome
- N concentration per cute0
- Direction
- loweste0
- Value
- 33.4 g kg −1e0
- Setting
- Whitefox sitee0
Organisms pictured · Representative pictures of the matched species, not figures from the paper.
Verbatim
e0“The lowest N concentration per cut was 33.4 g kg −1 averaged over the life of the stand at the Whitefox site”
t0“Alfalfa”
Claim · model-written summary
The highest herbage nitrogen concentration per cut was 39.7 g kg −1 at Waitville.
- Taxon
- AlfalfaMedicago sativat0
- Outcome
- N concentration in herbage per cute0
- Direction
- higheste0
- Value
- 39.7 g kg −1e0
- Setting
- Waitville sitee0
Organisms pictured · Representative pictures of the matched species, not figures from the paper.
Verbatim
e0“The highest N concentration in herbage per cut was 39.7 g kg −1 at the Waitville site”
t0“Alfalfa”
Claim · model-written summary
Sulfur fertilizer consistently increased nitrogen concentration only at Waitville after establishment.
- Taxon
- AlfalfaMedicago sativat0
- Treatment
- S fertilizere0
- Outcome
- N concentratione0
- Direction
- increasede0
- Qualifier
- after establishment yeare0
- Setting
- Wv 1 sitee0
Not reportedComparator
Organisms pictured · Representative pictures of the matched species, not figures from the paper.
Verbatim
e0“Only at the Wv 1 site, and only with S fertilizer, was N concentration consistently increased every year (after establishment year).”
t0“Alfalfa”
Claim · model-written summary
Alfalfa recovered 48 to 95% of applied nitrogen.
- Taxon
- alfalfaMedicago sativae0
- Outcome
- percentage of applied N recoverede0
- Value
- 48 to 95%e0
Not reportedDirection
Organisms pictured · Representative pictures of the matched species, not figures from the paper.
Verbatim
e0“The percentage of applied N recovered in the alfalfa ranged from 48 to 95%.”
Claim · model-written summary
Herbage removed approximately 14 kg sulfur per hectare yearly at Waitville under 22 kg sulfur fertilizer.
- Taxon
- AlfalfaMedicago sativat0
- Treatment
- 22 kg S ha −1e0
- Outcome
- S ha −1 per year (two cuts) was removed by herbagee0
- Value
- 14 kg S ha −1 per yeare0
- Setting
- Wv 1 sitee0
Not reportedDirection
Organisms pictured · Representative pictures of the matched species, not figures from the paper.
Verbatim
e0“Approximately 14 kg S ha −1 per year (two cuts) was removed by herbage when fertilized at 22 kg S ha −1 at the Wv 1 site.”
t0“Alfalfa”
Claim · model-written summary
Phosphorus uptake was approximately 19.0 kg per hectare yearly at 45 kg sulfur fertilizer.
- Taxon
- AlfalfaMedicago sativat0
- Treatment
- 45 kg S ha −1e0
- Outcome
- uptake of P per yeare0
- Value
- 19.0 kg P ha −1e0
Not reportedDirection
Organisms pictured · Representative pictures of the matched species, not figures from the paper.
Verbatim
e0“At a fertilizer rate of 45 kg S ha −1 , uptake of P per year (two cuts) was approximately 19.0 kg P ha −1 .”
t0“Alfalfa”
Claim · model-written summary
The lowest nitrogen yield was 78 kg per hectare per cut at Waitville.
- Taxon
- AlfalfaMedicago sativat0
- Outcome
- yield of Ne0
- Direction
- loweste0
- Value
- 78 kg N ha −1 per cute0
- Setting
- Wv 1 sitee0
Organisms pictured · Representative pictures of the matched species, not figures from the paper.
Verbatim
e0“The lowest yield of N was 78 kg N ha −1 per cut at the Wv 1 site”
t0“Alfalfa”
Claim · model-written summary
The highest nitrogen uptake was 128 kg per hectare per cut at Melfort.
- Taxon
- AlfalfaMedicago sativat0
- Outcome
- uptakee0
- Direction
- higheste0
- Value
- 128 kg N ha −1 per cute0
- Setting
- Melfort soil sitee0
Organisms pictured · Representative pictures of the matched species, not figures from the paper.
Verbatim
e0“The highest uptake was 128 kg N ha −1 per cut at the Melfort soil site”
t0“Alfalfa”
Claim · model-written summary
The study indicates an alfalfa herbage nitrogen to sulfur ratio of 14:1 to 21:1 as a limit for sulfur deficiency.
- Taxon
- alfalfaMedicago sativae0
- Outcome
- N to S ratio in herbagee0
- Value
- 14:1 to 21:1e0
Not reportedDirection
Organisms pictured · Representative pictures of the matched species, not figures from the paper.
Verbatim
e0“A range of 14:1 to 21:1 of the N to S ratio in herbage was the limit indicated for a S deficiency in the alfalfa crop.”
Claim · model-written summary
Plant testing could complement soil sulfur testing for fertilizer recommendations.
- Taxon
- AlfalfaMedicago sativat0
- Outcome
- Plant testing could be used in conjunction with the soil test for Se0
- Qualifier
- fertilizer recommendationse0
Organisms pictured · Representative pictures of the matched species, not figures from the paper.
Verbatim
e0“Plant testing could be used in conjunction with the soil test for S in making fertilizer recommendations.”
t0“Alfalfa”
The same questions in other papers
sulfur atom · nutrient: content · Medicago sativa (alfalfa)Results differ
6 papers in the same direction as this paper · 3 in the opposite direction
- no effect
- no effect
- no effect
6 papers more in this group
See all 10 papers →fertilization · nutrient: content · Medicago sativa (alfalfa)Positive and negative results
48 papers in the same direction as this paper · 9 in the opposite direction · 1 reporting no difference from an alternative
- no effect
- negative
- no effect
55 papers more in this group
See all 59 papers →Claims are grouped by organism, treatment and what was measured or targeted. A paper counts as positive when any of its claims in the group is positive.