Abstract
In the study, the effects of elevated CO2 and temperature on the nitrogen content, carbon content, and C:N ratio of seven rare and endangered species (Quercus gilva, Hibiscus hambo, Paliurus ramosissimus, Cicuta virosa, Bupleurum latissimum, Viola raddeana, and Iris dichotoma) were examined under control (ambient CO2 + ambient temperature) and treatment (elevated CO2 + elevated temperature) for 3 years (May 2008 and June 2011). Elevated CO2 concentration and temperature result in a decline in leaf nitrogen content for three woody species in May 2009 and June 2011, while four herb species showed different responses to each other. The nitrogen content of B. latissimum and I. dichotoma decreased under treatment in either 2009 and 2011. The leaf nitrogen content of C. virosa and V. raddeana was not significantly affected by elevated CO2 and temperature in 2009, but that of C. virosa increased and that V. raddeana decreased under the treatment in 2011. In 2009, it was found that there was no difference in carbon content in the leaves of the six species except for that of P. ramosissimus. On the other hand, while there was no difference in carbon content in the leaves of Q. gilva in the control and treatment in 2011, carbon content in the leaves of the remaining six species increased due to the rise of CO2 concentration and temperature. The C:N ratio in the leaf of C. virosa grown in the treatment was lower in both 2009 and 2011 than that in the control. The C:N ratio in the leaf of V. raddeana decreased by 16.4% from the previous year, but increased by 28.9% in 2011. For the other five species, C:N ratios increased both in 2009 and 2011. In 2009 and 2011, chlorophyll contents in the leaves of Q. gilva and H. hamabo were higher in the treatment than those in the control. In the case of P. ramosissimus, the ratio was higher in the treatment than that in the control in 2009, but in 2011, the result was the opposite. Among four herb species, the chlorophyll contents in the leaves of C. virosa, V. raddeana, and I. dichotoma did not show any difference between gradients in 2009, but decreased due to the rise of CO2 concentration and temperature in 2011. Leaf nitrogen and carbon contents, C:N ratio, and chlorophyll contents in the leaves of seven rare and endangered species of plant were found to be influenced by the rise and duration of CO2 concentration and temperature, species, and interaction among those factors. The findings above seem to show that long-term rise of CO2 concentration, and temperature causes changes in physiological responses of rare and endangered species of plant and the responses may be species-specific. In particular, woody species seem to be more sensitive to the rise of CO2 concentration and temperature than herb species.
Abstract from the paper’s OpenAlex record; open copy licensed cc-by. Read at the source ↗
The text the model read, with the source record’s inline markup (italics, sub- and superscripts) rendered and its character entities decoded; quote offsets refer to the raw text.
Claims 19
Claim · model-written summary
Elevated CO2 and temperature decreased leaf nitrogen content in three woody species in May 2009 and June 2011.
Verbatim
e0“examined under control (ambient CO2 + ambient temperature) and treatment (elevated CO2 + elevated temperature) for 3 years”
e2“Elevated CO2 concentration and temperature result in a decline in leaf nitrogen content for three woody species in May 2009 and June 2011”
Claim · model-written summary
Elevated CO2 and temperature decreased leaf nitrogen content of B. latissimum and I. dichotoma under treatment in 2009 and 2011.
- Taxon
- B. latissimum and I. dichotoma
 Iris dichotomaBupleurum latissimume2
- Treatment
- elevated CO2 + elevated temperaturee0
- Outcome
- nitrogen contente2
- Direction
- decreasede2
- Qualifier
- in either 2009 and 2011e2
- Comparator
- control (ambient CO2 + ambient temperature)e0
Organisms pictured · Representative pictures of the matched species, not figures from the paper.

Verbatim
e0“examined under control (ambient CO2 + ambient temperature) and treatment (elevated CO2 + elevated temperature) for 3 years”
e2“The nitrogen content of B. latissimum and I. dichotoma decreased under treatment in either 2009 and 2011”
Claim · model-written summary
Elevated CO2 and temperature did not significantly affect leaf nitrogen content of C. virosa and V. raddeana in 2009.
- Taxon
- C. virosa and V. raddeana
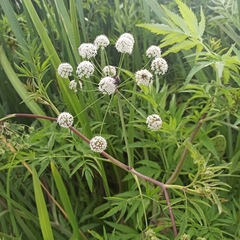 Cicuta virosa
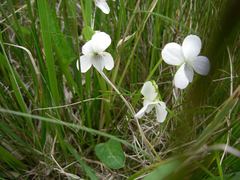 Viola raddeanae3
- Treatment
- elevated CO2 and temperaturee3
- Outcome
- leaf nitrogen contente3
- Direction
- not significantly affectede3
- Qualifier
- in 2009e3
- Comparator
- control (ambient CO2 + ambient temperature)e0
Organisms pictured · Representative pictures of the matched species, not figures from the paper.
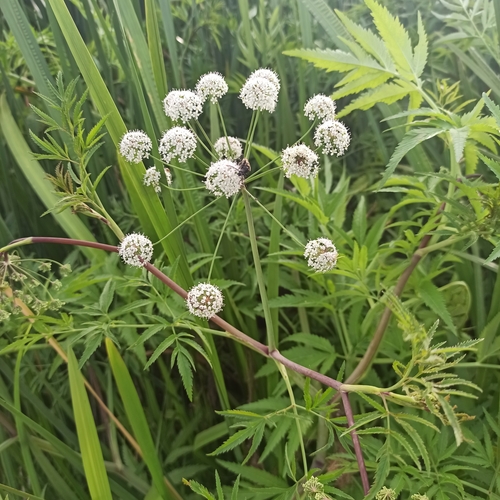

Verbatim
e0“examined under control (ambient CO2 + ambient temperature) and treatment (elevated CO2 + elevated temperature) for 3 years”
e3“The leaf nitrogen content of C. virosa and V. raddeana was not significantly affected by elevated CO2 and temperature in 2009”
Claim · model-written summary
Elevated CO2 and temperature increased leaf nitrogen content of C. virosa under treatment in 2011.
- Taxon
- C. virosaCicuta virosae4
- Treatment
- elevated CO2 + elevated temperaturee0
- Outcome
- leaf nitrogen contente3
- Direction
- increasede4
- Qualifier
- in 2011e4
- Comparator
- control (ambient CO2 + ambient temperature)e0
Organisms pictured · Representative pictures of the matched species, not figures from the paper.
Verbatim
e0“examined under control (ambient CO2 + ambient temperature) and treatment (elevated CO2 + elevated temperature) for 3 years”
e3“The leaf nitrogen content of C. virosa and V. raddeana was not significantly affected by elevated CO2 and temperature in 2009”
e4“but that of C. virosa increased and that V. raddeana decreased under the treatment in 2011”
Claim · model-written summary
Elevated CO2 and temperature decreased leaf nitrogen content of V. raddeana under treatment in 2011.
- Taxon
- V. raddeanaViola raddeanae4
- Treatment
- elevated CO2 + elevated temperaturee0
- Outcome
- leaf nitrogen contente3
- Direction
- decreasede4
- Qualifier
- in 2011e4
- Comparator
- control (ambient CO2 + ambient temperature)e0
Organisms pictured · Representative pictures of the matched species, not figures from the paper.
Verbatim
e0“examined under control (ambient CO2 + ambient temperature) and treatment (elevated CO2 + elevated temperature) for 3 years”
e3“The leaf nitrogen content of C. virosa and V. raddeana was not significantly affected by elevated CO2 and temperature in 2009”
e4“but that of C. virosa increased and that V. raddeana decreased under the treatment in 2011”
Claim · model-written summary
Elevated CO2 and temperature did not change leaf carbon content in 2009 in the six species other than P. ramosissimus.
Verbatim
e0“examined under control (ambient CO2 + ambient temperature) and treatment (elevated CO2 + elevated temperature) for 3 years”
e5“In 2009, it was found that there was no difference in carbon content in the leaves of the six species except for that of P. ramosissimus”
Claim · model-written summary
Elevated CO2 and temperature did not change leaf carbon content of Q. gilva in 2011.
- Taxon
- Q. gilva
 Quercus gilvae6
- Treatment
- elevated CO2 + elevated temperaturee0
- Outcome
- carbon contente6
- Direction
- no differencee6
- Qualifier
- in 2011e6
- Comparator
- control (ambient CO2 + ambient temperature)e0
Organisms pictured · Representative pictures of the matched species, not figures from the paper.

Verbatim
e0“examined under control (ambient CO2 + ambient temperature) and treatment (elevated CO2 + elevated temperature) for 3 years”
e6“while there was no difference in carbon content in the leaves of Q. gilva in the control and treatment in 2011”
Claim · model-written summary
Rising CO2 concentration and temperature increased leaf carbon content of the remaining six species in 2011.
Verbatim
e0“examined under control (ambient CO2 + ambient temperature) and treatment (elevated CO2 + elevated temperature) for 3 years”
e7“carbon content in the leaves of the remaining six species increased due to the rise of CO2 concentration and temperature”
Claim · model-written summary
Elevated CO2 and temperature lowered the leaf C:N ratio of C. virosa in both 2009 and 2011.
- Taxon
- C. virosaCicuta virosae1
- Treatment
- elevated CO2 + elevated temperaturee0
- Outcome
- C:N ratioe1
- Direction
- lowere1
- Qualifier
- in both 2009 and 2011e1
- Comparator
- control (ambient CO2 + ambient temperature)e0
Organisms pictured · Representative pictures of the matched species, not figures from the paper.
Verbatim
e0“examined under control (ambient CO2 + ambient temperature) and treatment (elevated CO2 + elevated temperature) for 3 years”
e1“The C:N ratio in the leaf of C. virosa grown in the treatment was lower in both 2009 and 2011 than that in the control”
Claim · model-written summary
The leaf C:N ratio of V. raddeana decreased by 16.4% from the previous year.
- Taxon
- V. raddeanaViola raddeanae1
- Outcome
- C:N ratioe1
- Direction
- decreasede1
- Value
- 16.4%e1
- Comparator
- from the previous yeare1
Organisms pictured · Representative pictures of the matched species, not figures from the paper.
Verbatim
e1“The C:N ratio in the leaf of V. raddeana decreased by 16.4% from the previous year, but increased by 28.9% in 2011”
Claim · model-written summary
The leaf C:N ratio of V. raddeana increased by 28.9% in 2011.
- Taxon
- V. raddeanaViola raddeanae1
- Outcome
- C:N ratioe1
- Direction
- increasede1
- Value
- 28.9%e1
- Qualifier
- in 2011e1
Organisms pictured · Representative pictures of the matched species, not figures from the paper.
Verbatim
e1“The C:N ratio in the leaf of V. raddeana decreased by 16.4% from the previous year, but increased by 28.9% in 2011”
Claim · model-written summary
Elevated CO2 and temperature increased the C:N ratios of the other five species in 2009 and 2011.
Verbatim
e0“examined under control (ambient CO2 + ambient temperature) and treatment (elevated CO2 + elevated temperature) for 3 years”
e1“For the other five species, C:N ratios increased both in 2009 and 2011”
Claim · model-written summary
Elevated CO2 and temperature raised leaf chlorophyll contents of Q. gilva and H. hamabo in 2009 and 2011.
- Taxon
- Q. gilva and H. hamaboQuercus gilva
 Talipariti hamaboe1
- Treatment
- elevated CO2 + elevated temperaturee0
- Outcome
- chlorophyll contentse1
- Direction
- highere1
- Qualifier
- In 2009 and 2011e1
- Comparator
- control (ambient CO2 + ambient temperature)e0
Organisms pictured · Representative pictures of the matched species, not figures from the paper.

Verbatim
e0“examined under control (ambient CO2 + ambient temperature) and treatment (elevated CO2 + elevated temperature) for 3 years”
e1“In 2009 and 2011, chlorophyll contents in the leaves of Q. gilva and H. hamabo were higher in the treatment than those in the control”
Claim · model-written summary
Elevated CO2 and temperature raised the chlorophyll ratio of P. ramosissimus in 2009.
- Taxon
- P. ramosissimus
 Paliurus ramosissimuse1
- Treatment
- elevated CO2 + elevated temperaturee0
- Outcome
- the ratioe1
- Direction
- highere1
- Qualifier
- in 2009e1
- Comparator
- control (ambient CO2 + ambient temperature)e0
Organisms pictured · Representative pictures of the matched species, not figures from the paper.

Verbatim
e0“examined under control (ambient CO2 + ambient temperature) and treatment (elevated CO2 + elevated temperature) for 3 years”
e1“In the case of P. ramosissimus, the ratio was higher in the treatment than that in the control in 2009, but in 2011, the result was the opposite”
Claim · model-written summary
The chlorophyll ratio of P. ramosissimus in the treatment showed the opposite response in 2011.
- Taxon
- P. ramosissimusPaliurus ramosissimuse1
- Treatment
- elevated CO2 + elevated temperaturee0
- Outcome
- the ratioe1
- Direction
- the oppositee1
- Qualifier
- in 2011e1
- Comparator
- control (ambient CO2 + ambient temperature)e0
Organisms pictured · Representative pictures of the matched species, not figures from the paper.
Verbatim
e0“examined under control (ambient CO2 + ambient temperature) and treatment (elevated CO2 + elevated temperature) for 3 years”
e1“In the case of P. ramosissimus, the ratio was higher in the treatment than that in the control in 2009, but in 2011, the result was the opposite”
Claim · model-written summary
Elevated CO2 and temperature did not change leaf chlorophyll contents of C. virosa, V. raddeana and I. dichotoma in 2009.
- Taxon
- C. virosa, V. raddeana, and I. dichotomaCicuta virosaIris dichotomaViola raddeanae1
- Treatment
- elevated CO2 + elevated temperaturee0
- Outcome
- chlorophyll contentse1
- Direction
- did not show any differencee1
- Qualifier
- in 2009e1
- Comparator
- control (ambient CO2 + ambient temperature)e0
Organisms pictured · Representative pictures of the matched species, not figures from the paper.
Verbatim
e0“examined under control (ambient CO2 + ambient temperature) and treatment (elevated CO2 + elevated temperature) for 3 years”
e1“Among four herb species, the chlorophyll contents in the leaves of C. virosa, V. raddeana, and I. dichotoma did not show any difference between gradients in 2009, but decreased due to the rise of CO2 concentration and temperature in 2011”
Claim · model-written summary
Rising CO2 concentration and temperature decreased leaf chlorophyll contents of C. virosa, V. raddeana and I. dichotoma in 2011.
- Taxon
- C. virosa, V. raddeana, and I. dichotomaCicuta virosaIris dichotomaViola raddeanae1
- Treatment
- rise of CO2 concentration and temperaturee1
- Outcome
- chlorophyll contentse1
- Direction
- decreasede1
- Qualifier
- in 2011e1
- Comparator
- control (ambient CO2 + ambient temperature)e0
Organisms pictured · Representative pictures of the matched species, not figures from the paper.
Verbatim
e0“examined under control (ambient CO2 + ambient temperature) and treatment (elevated CO2 + elevated temperature) for 3 years”
e1“Among four herb species, the chlorophyll contents in the leaves of C. virosa, V. raddeana, and I. dichotoma did not show any difference between gradients in 2009, but decreased due to the rise of CO2 concentration and temperature in 2011”
Claim · model-written summary
Woody species seem more sensitive than herb species to the rise of CO2 concentration and temperature.
Verbatim
e1“In particular, woody species seem to be more sensitive to the rise of CO2 concentration and temperature than herb species”
Claim · model-written summary
Long-term rise of CO2 concentration and temperature is associated with changes in physiological responses of rare and endangered plant species, which may be species-specific.
- Taxon
- rare and endangered species of plante1
- Treatment
- long-term rise of CO2 concentration, and temperaturee1
- Outcome
- physiological responsese1
- Qualifier
- the responses may be species-specifice1
Not reportedDirection
Verbatim
e1“The findings above seem to show that long-term rise of CO2 concentration, and temperature causes changes in physiological responses of rare and endangered species of plant and the responses may be species-specific”