Abstract
Abstract Besides carbon sequestration, biochar amendment in soils can regulate the loss of applied fertilizer-nitrogen (N) into the environment. Soil aggregates are essential in controlling soil N stocks' stabilization and supply. However, unraveling the rate-dependent impact of biochar on stable soil aggregates and their associated N in fertilized soils over an extended period is a prerequisite to understanding its implications on soil-N dynamics. We unraveled how high and low biochar application rates combined with inorganic fertilizer (20- and 40-tons ha −1 [FB1 and FB2]) affected soil N fractions, stable soil aggregates, aggregates associated-N, and microbial responses to regulate N supply for Nageia nagi after one year. Results revealed that biochar amendment, especially at higher rate, increased the concentration of inorganic N and some amino acids compared to sole fertilizer (F). Available N increased by 16.5% ( p = 0.057), 23.8% ( p = 0.033), and 34.8% ( p = 0.028) in F, FB1, and FB2, respectively, compared to the control (C). Also, 28.1% and 32.8% significant increases in the availability of NH 4 + -N were recorded in FB1 and FB2, respectively, compared to F. NO 3 − -N availability was significantly increased by 15.2%, 21.8%, and 20.8% in FB1, FB2, and C, compared to F. Biochar amendment, irrespective of rate, increased stable microaggregates (< 0.25 mm). However, FB2 significantly increased macro- and intermediate-aggregate-N, and urease activity, and hence higher N supply capacity to meet the N need of N. nagi even after one year. Hence, the N content of N. nagi was 41.3%, 28.8%, and 12.2% higher in FB2, FB1, and F, respectively, compared to the control. Biochar amendment decreased bacterial species diversity but increased the proportion of NH 4 + -oxidizers (especially the Betaproteobacteria) to maintain the mineralization and slow release of N. Although a low biochar rate was more beneficial than sole fertilization, higher biochar application rate could sustain higher N supply by stabilizing soil microaggregates and increasing macro- and intermediate-aggregates N, its mineralization, and slow-release over longer periods.
Abstract from the paper’s OpenAlex record; open copy licensed cc-by. Read at the source ↗
The text the model read, with the source record’s inline markup (italics, sub- and superscripts) rendered and its character entities decoded; quote offsets refer to the raw text.
Claims 20
Claim · model-written summary
Biochar, especially at the higher rate, increased inorganic N concentration versus fertilizer alone.
- Taxon
- Nageia nagi
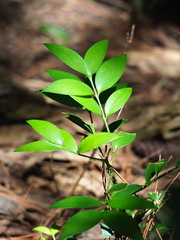 Nageia nagit0
- Treatment
- biochar amendmente0
- Outcome
- concentration of inorganic Ne0
- Direction
- increasede0
- Comparator
- sole fertilizer (F)e0
Organisms pictured · Representative pictures of the matched species, not figures from the paper.
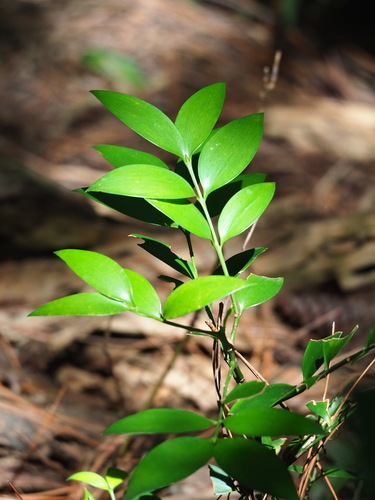
Verbatim
e0“biochar amendment, especially at higher rate, increased the concentration of inorganic N and some amino acids compared to sole fertilizer (F)”
t0“Nageia nagi after one year”
Claim · model-written summary
Biochar, especially at the higher rate, increased some amino acids versus fertilizer alone.
- Taxon
- Nageia nagiNageia nagit0
- Treatment
- biochar amendmente0
- Outcome
- some amino acidse0
- Direction
- increasede0
- Comparator
- sole fertilizer (F)e0
Organisms pictured · Representative pictures of the matched species, not figures from the paper.
Verbatim
e0“biochar amendment, especially at higher rate, increased the concentration of inorganic N and some amino acids compared to sole fertilizer (F)”
t0“Nageia nagi after one year”
Claim · model-written summary
Available N increased 16.5% with fertilizer versus control.
- Taxon
- Nageia nagiNageia nagit0
- Treatment
- Fe0
- Outcome
- Available Ne0
- Direction
- increasede0
- Value
- 16.5%e0
- Comparator
- control (C)e0
Organisms pictured · Representative pictures of the matched species, not figures from the paper.
Verbatim
e0“Available N increased by 16.5% ( p = 0.057), 23.8% ( p = 0.033), and 34.8% ( p = 0.028) in F, FB1, and FB2, respectively, compared to the control (C)”
t0“Nageia nagi after one year”
Claim · model-written summary
Available N increased 23.8% with FB1 versus control.
- Taxon
- Nageia nagiNageia nagit0
- Treatment
- FB1e0
- Outcome
- Available Ne0
- Direction
- increasede0
- Value
- 23.8%e0
- Comparator
- control (C)e0
Organisms pictured · Representative pictures of the matched species, not figures from the paper.
Verbatim
e0“Available N increased by 16.5% ( p = 0.057), 23.8% ( p = 0.033), and 34.8% ( p = 0.028) in F, FB1, and FB2, respectively, compared to the control (C)”
t0“Nageia nagi after one year”
Claim · model-written summary
Available N increased 34.8% with FB2 versus control.
- Taxon
- Nageia nagiNageia nagit0
- Treatment
- FB2e0
- Outcome
- Available Ne0
- Direction
- increasede0
- Value
- 34.8%e0
- Comparator
- control (C)e0
Organisms pictured · Representative pictures of the matched species, not figures from the paper.
Verbatim
e0“Available N increased by 16.5% ( p = 0.057), 23.8% ( p = 0.033), and 34.8% ( p = 0.028) in F, FB1, and FB2, respectively, compared to the control (C)”
t0“Nageia nagi after one year”
Claim · model-written summary
FB1 increased NH4+-N availability 28.1% versus fertilizer alone.
- Taxon
- Nageia nagiNageia nagit0
- Treatment
- FB1e0
- Outcome
- availability of NH 4 + -Ne0
- Direction
- increasese0
- Value
- 28.1%e0
- Comparator
- Fe0
Organisms pictured · Representative pictures of the matched species, not figures from the paper.
Verbatim
e0“28.1% and 32.8% significant increases in the availability of NH 4 + -N were recorded in FB1 and FB2, respectively, compared to F”
t0“Nageia nagi after one year”
Claim · model-written summary
FB2 increased NH4+-N availability 32.8% versus fertilizer alone.
- Taxon
- Nageia nagiNageia nagit0
- Treatment
- FB2e0
- Outcome
- availability of NH 4 + -Ne0
- Direction
- increasese0
- Value
- 32.8%e0
- Comparator
- Fe0
Organisms pictured · Representative pictures of the matched species, not figures from the paper.
Verbatim
e0“28.1% and 32.8% significant increases in the availability of NH 4 + -N were recorded in FB1 and FB2, respectively, compared to F”
t0“Nageia nagi after one year”
Claim · model-written summary
FB1 increased NO3−-N availability 15.2% versus fertilizer alone.
- Taxon
- Nageia nagiNageia nagit0
- Treatment
- FB1e0
- Outcome
- NO 3 − -N availabilitye0
- Direction
- increasede0
- Value
- 15.2%e0
- Comparator
- Fe0
Organisms pictured · Representative pictures of the matched species, not figures from the paper.
Verbatim
e0“NO 3 − -N availability was significantly increased by 15.2%, 21.8%, and 20.8% in FB1, FB2, and C, compared to F”
t0“Nageia nagi after one year”
Claim · model-written summary
FB2 increased NO3−-N availability 21.8% versus fertilizer alone.
- Taxon
- Nageia nagiNageia nagit0
- Treatment
- FB2e0
- Outcome
- NO 3 − -N availabilitye0
- Direction
- increasede0
- Value
- 21.8%e0
- Comparator
- Fe0
Organisms pictured · Representative pictures of the matched species, not figures from the paper.
Verbatim
e0“NO 3 − -N availability was significantly increased by 15.2%, 21.8%, and 20.8% in FB1, FB2, and C, compared to F”
t0“Nageia nagi after one year”
Claim · model-written summary
Control increased NO3−-N availability 20.8% versus fertilizer alone.
- Taxon
- Nageia nagiNageia nagit0
- Treatment
- Ce0
- Outcome
- NO 3 − -N availabilitye0
- Direction
- increasede0
- Value
- 20.8%e0
- Comparator
- Fe0
Organisms pictured · Representative pictures of the matched species, not figures from the paper.
Verbatim
e0“NO 3 − -N availability was significantly increased by 15.2%, 21.8%, and 20.8% in FB1, FB2, and C, compared to F”
t0“Nageia nagi after one year”
Claim · model-written summary
Biochar increased stable microaggregates regardless of rate.
- Taxon
- Nageia nagiNageia nagit0
- Treatment
- Biochar amendmente0
- Outcome
- stable microaggregatese0
- Direction
- increasede0
Not reportedComparator
Organisms pictured · Representative pictures of the matched species, not figures from the paper.
Verbatim
e0“Biochar amendment, irrespective of rate, increased stable microaggregates (< 0.25 mm)”
t0“Nageia nagi after one year”
Claim · model-written summary
FB2 increased macro- and intermediate-aggregate N.
- Taxon
- Nageia nagiNageia nagit0
- Treatment
- FB2e0
- Outcome
- macro- and intermediate-aggregate-Ne0
- Direction
- increasede0
Not reportedComparator
Organisms pictured · Representative pictures of the matched species, not figures from the paper.
Verbatim
e0“FB2 significantly increased macro- and intermediate-aggregate-N, and urease activity”
t0“Nageia nagi after one year”
Claim · model-written summary
FB2 increased urease activity.
- Taxon
- Nageia nagiNageia nagit0
- Treatment
- FB2e0
- Outcome
- urease activitye0
- Direction
- increasede0
Not reportedComparator
Organisms pictured · Representative pictures of the matched species, not figures from the paper.
Verbatim
e0“FB2 significantly increased macro- and intermediate-aggregate-N, and urease activity”
t0“Nageia nagi after one year”
Claim · model-written summary
FB2 had higher N supply capacity after one year.
- Taxon
- Nageia nagiNageia nagit0
- Outcome
- N supply capacitye0
- Direction
- highere0
- Qualifier
- even after one yeare0
Organisms pictured · Representative pictures of the matched species, not figures from the paper.
Verbatim
e0“higher N supply capacity to meet the N need of N. nagi even after one year”
t0“Nageia nagi after one year”
Claim · model-written summary
N. nagi N content was 41.3% higher with FB2 than control.
- Taxon
- Nageia nagiNageia nagit0
- Treatment
- FB2e0
- Outcome
- N content of N. nagie0
- Direction
- highere0
- Value
- 41.3%e0
- Comparator
- the controle0
Organisms pictured · Representative pictures of the matched species, not figures from the paper.
Verbatim
e0“the N content of N. nagi was 41.3%, 28.8%, and 12.2% higher in FB2, FB1, and F, respectively, compared to the control”
t0“Nageia nagi after one year”
Claim · model-written summary
N. nagi N content was 28.8% higher with FB1 than control.
- Taxon
- Nageia nagiNageia nagit0
- Treatment
- FB1e0
- Outcome
- N content of N. nagie0
- Direction
- highere0
- Value
- 28.8%e0
- Comparator
- the controle0
Organisms pictured · Representative pictures of the matched species, not figures from the paper.
Verbatim
e0“the N content of N. nagi was 41.3%, 28.8%, and 12.2% higher in FB2, FB1, and F, respectively, compared to the control”
t0“Nageia nagi after one year”
Claim · model-written summary
N. nagi N content was 12.2% higher with fertilizer than control.
- Taxon
- Nageia nagiNageia nagit0
- Treatment
- Fe0
- Outcome
- N content of N. nagie0
- Direction
- highere0
- Value
- 12.2%e0
- Comparator
- the controle0
Organisms pictured · Representative pictures of the matched species, not figures from the paper.
Verbatim
e0“the N content of N. nagi was 41.3%, 28.8%, and 12.2% higher in FB2, FB1, and F, respectively, compared to the control”
t0“Nageia nagi after one year”
Claim · model-written summary
Biochar decreased bacterial species diversity.
- Taxon
- Nageia nagiNageia nagit0
- Treatment
- Biochar amendmente0
- Outcome
- bacterial species diversitye0
- Direction
- decreasede0
Not reportedComparator
Organisms pictured · Representative pictures of the matched species, not figures from the paper.
Verbatim
e0“Biochar amendment decreased bacterial species diversity but increased the proportion of NH 4 + -oxidizers (especially the Betaproteobacteria)”
t0“Nageia nagi after one year”
Claim · model-written summary
Biochar increased the proportion of NH4+-oxidizers.
- Taxon
- Nageia nagiNageia nagit0
- Treatment
- Biochar amendmente0
- Outcome
- proportion of NH 4 + -oxidizerse0
- Direction
- increasede0
Not reportedComparator
Organisms pictured · Representative pictures of the matched species, not figures from the paper.
Verbatim
e0“Biochar amendment decreased bacterial species diversity but increased the proportion of NH 4 + -oxidizers (especially the Betaproteobacteria)”
t0“Nageia nagi after one year”
Claim · model-written summary
Higher biochar rate could sustain higher N supply over longer periods.
- Taxon
- Nageia nagiNageia nagit0
- Treatment
- higher biochar application ratee0
- Outcome
- N supplye0
- Direction
- highere0
- Qualifier
- stabilizing soil microaggregates and increasing macro- and intermediate-aggregates N, its mineralization, and slow-releasee0
Organisms pictured · Representative pictures of the matched species, not figures from the paper.
Verbatim
e0“higher biochar application rate could sustain higher N supply by stabilizing soil microaggregates and increasing macro- and intermediate-aggregates N, its mineralization, and slow-release over longer periods”
t0“Nageia nagi after one year”