Abstract
Background: A significant concern today is the dependence on low-quality water sources, such as saline water, in hydroponic systems, especially due to the scarcity of freshwater. Halophytes and salt-tolerant species have emerged as viable candidates for cultivation in saline hydroponics. However, their agronomic performance and physiological responses within hydroponic systems require further investigation. Objectives: This research aims to explore the potential of edible halophytes grown in saline nutrient solutions within hydroponic systems within salt-tolerant ranges, focusing on their metabolic profiles and mineral accumulation. Methods: Plantago coronopus (L.), Portulaca oleracea (L.), and Salsola komarovii (Iljin) were grown in walk-in controlled environment chambers in deep water culture hydroponic systems, at 0, 50, 100, 150, and 200 mM·L−1 NaCl salinity; 16h, 250 µmol m−2 s−1, and wide LED spectrum lighting was maintained. Results: A significant decrease in organic acids, and fresh and dry weight under high saltinity was observed in Plantago coronopus and Portulaca oleracea, but not in Salsola komarovii. An increase in hexoses, particularly glucose, violaxanthin and β-carotene, P⁺ and Zn2⁺, along with a decrease in lutein, K⁺ and Ca2⁺ levels across salinity levels from 0 to 200 mM NaCl was observed in all treated halophytes. Increased salinity did not significantly affect total protein accumulation. Conclusions: These findings reveal that different shifts in osmolytes, mineral elements, and biomass accumulation in tested halophytes indicate species-dependent osmotic adjustment to increased salinity and may be attributed to the morphological differences among halophytic grasses, dicot halophytes, and those with succulent leaves or stems. The PCA score scatterplot results excluded the response of Plantago coronopus from other tested halophytes; also, it demonstrated that Portulaca oleracea was more sensitive to the hydroponic solution salinity compared to Salsola komarovii and Plantago coronopus.
Abstract from the paper’s OpenAlex record; open copy licensed cc-by. Read at the source ↗
The text the model read, with the source record’s inline markup (italics, sub- and superscripts) rendered and its character entities decoded; quote offsets refer to the raw text.
Claims 11
Claim · model-written summary
High salinity significantly decreased organic acids, fresh weight and dry weight of Plantago coronopus.
- Taxon
- Plantago coronopus
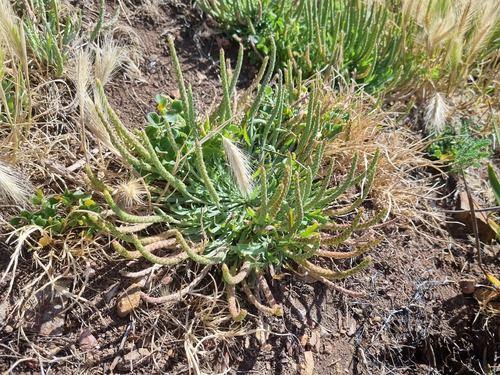
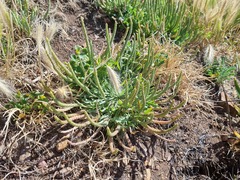 Plantago coronopuse1
- Treatment
- high saltinitye1
- Outcome
- organic acids, and fresh and dry weighte1
- Direction
- decreasee1
Not reportedComparator
Organisms pictured · Representative pictures of the matched species, not figures from the paper.
Verbatim
e0“Plantago coronopus (L.), Portulaca oleracea (L.), and Salsola komarovii (Iljin) were grown”
e1“A significant decrease in organic acids, and fresh and dry weight under high saltinity was observed in Plantago coronopus and Portulaca oleracea, but not in Salsola komarovii”
Claim · model-written summary
High salinity significantly decreased organic acids, fresh weight and dry weight of Portulaca oleracea.
- Taxon
- Portulaca oleracea
 Portulaca oleraceae1
- Treatment
- high saltinitye1
- Outcome
- organic acids, and fresh and dry weighte1
- Direction
- decreasee1
Not reportedComparator
Organisms pictured · Representative pictures of the matched species, not figures from the paper.

Verbatim
e0“Plantago coronopus (L.), Portulaca oleracea (L.), and Salsola komarovii (Iljin) were grown”
e1“A significant decrease in organic acids, and fresh and dry weight under high saltinity was observed in Plantago coronopus and Portulaca oleracea, but not in Salsola komarovii”
Claim · model-written summary
Salsola komarovii showed no decrease in organic acids, fresh weight or dry weight under high salinity.
- Taxon
- Salsola komarovii
 Salsola komaroviie1
- Treatment
- high saltinitye1
- Outcome
- organic acids, and fresh and dry weighte1
- Direction
- no_changeinferrede1
Not reportedComparator
Organisms pictured · Representative pictures of the matched species, not figures from the paper.

Verbatim
e0“Plantago coronopus (L.), Portulaca oleracea (L.), and Salsola komarovii (Iljin) were grown”
e1“A significant decrease in organic acids, and fresh and dry weight under high saltinity was observed in Plantago coronopus and Portulaca oleracea, but not in Salsola komarovii”
Claim · model-written summary
Across salinity levels from 0 to 200 mM NaCl, hexoses, particularly glucose, increased in all treated halophytes.
- Taxon
- halophytese2
- Treatment
- salinity levels from 0 to 200 mM NaCle2
- Outcome
- hexoses, particularly glucosee2
- Direction
- increasee2
Not reportedComparator
Verbatim
e2“An increase in hexoses, particularly glucose, violaxanthin and β-carotene, P⁺ and Zn2⁺, along with a decrease in lutein, K⁺ and Ca2⁺ levels across salinity levels from 0 to 200 mM NaCl was observed in all treated halophytes”
Claim · model-written summary
Across salinity levels from 0 to 200 mM NaCl, violaxanthin and β-carotene increased in all treated halophytes.
- Taxon
- halophytese2
- Treatment
- salinity levels from 0 to 200 mM NaCle2
- Outcome
- violaxanthin and β-carotenee2
- Direction
- increasee2
Not reportedComparator
Verbatim
e2“An increase in hexoses, particularly glucose, violaxanthin and β-carotene, P⁺ and Zn2⁺, along with a decrease in lutein, K⁺ and Ca2⁺ levels across salinity levels from 0 to 200 mM NaCl was observed in all treated halophytes”
Claim · model-written summary
Across salinity levels from 0 to 200 mM NaCl, P⁺ and Zn2⁺ increased in all treated halophytes.
- Taxon
- halophytese2
- Treatment
- salinity levels from 0 to 200 mM NaCle2
- Outcome
- P⁺ and Zn2⁺e2
- Direction
- increasee2
Not reportedComparator
Verbatim
e2“An increase in hexoses, particularly glucose, violaxanthin and β-carotene, P⁺ and Zn2⁺, along with a decrease in lutein, K⁺ and Ca2⁺ levels across salinity levels from 0 to 200 mM NaCl was observed in all treated halophytes”
Claim · model-written summary
Across salinity levels from 0 to 200 mM NaCl, lutein, K⁺ and Ca2⁺ decreased in all treated halophytes.
- Taxon
- halophytese2
- Treatment
- salinity levels from 0 to 200 mM NaCle2
- Outcome
- lutein, K⁺ and Ca2⁺e2
- Direction
- decreasee2
Not reportedComparator
Verbatim
e2“An increase in hexoses, particularly glucose, violaxanthin and β-carotene, P⁺ and Zn2⁺, along with a decrease in lutein, K⁺ and Ca2⁺ levels across salinity levels from 0 to 200 mM NaCl was observed in all treated halophytes”
Claim · model-written summary
Increased salinity did not significantly affect total protein accumulation in the halophytes.
- Taxon
- halophytese2
- Treatment
- Increased salinitye4
- Outcome
- total protein accumulatione4
- Direction
- no_changeinferrede4
Not reportedComparator
Verbatim
e2“An increase in hexoses, particularly glucose, violaxanthin and β-carotene, P⁺ and Zn2⁺, along with a decrease in lutein, K⁺ and Ca2⁺ levels across salinity levels from 0 to 200 mM NaCl was observed in all treated halophytes”
e4“Increased salinity did not significantly affect total protein accumulation”
Claim · model-written summary
Portulaca oleracea was more sensitive to the hydroponic solution salinity than Salsola komarovii and Plantago coronopus.
- Taxon
- Portulaca oleraceaPortulaca oleraceae6
- Treatment
- hydroponic solution salinitye6
- Outcome
- sensitive to the hydroponic solution salinitye6
- Direction
- more sensitivee6
- Comparator
- Salsola komarovii and Plantago coronopuse6
Organisms pictured · Representative pictures of the matched species, not figures from the paper.
Verbatim
e0“Plantago coronopus (L.), Portulaca oleracea (L.), and Salsola komarovii (Iljin) were grown”
e6“it demonstrated that Portulaca oleracea was more sensitive to the hydroponic solution salinity compared to Salsola komarovii and Plantago coronopus”
Claim · model-written summary
The PCA score scatterplot separated the response of Plantago coronopus from the other tested halophytes.
- Taxon
- Plantago coronopusPlantago coronopuse5
- Outcome
- PCA score scatterplot resultse5
Not reportedDirection
Organisms pictured · Representative pictures of the matched species, not figures from the paper.
Verbatim
e0“Plantago coronopus (L.), Portulaca oleracea (L.), and Salsola komarovii (Iljin) were grown”
e5“The PCA score scatterplot results excluded the response of Plantago coronopus from other tested halophytes”
Claim · model-written summary
The species-dependent osmotic adjustment of the halophytes to increased salinity may be attributed to morphological differences.
Verbatim
e2“An increase in hexoses, particularly glucose, violaxanthin and β-carotene, P⁺ and Zn2⁺, along with a decrease in lutein, K⁺ and Ca2⁺ levels across salinity levels from 0 to 200 mM NaCl was observed in all treated halophytes”
e7“species-dependent osmotic adjustment to increased salinity and may be attributed to the morphological differences among halophytic grasses”
The same questions in other papers
salinity · growth · Portulaca oleraceaResults agree
2 papers in the same direction as this paper
- negative
- negative
Claims are grouped by organism, treatment and what was measured or targeted. A paper counts as positive when any of its claims in the group is positive.