View: List Claim type Research area Organism Taxon as written Decade Paper Method / resource observed original result measured Claim · model-written summary
The best NIRS calibration equation for TIVD had a standard error of selection of 20.7 g kg −1.
standard error of selection e5 Verbatim
e5 “a standard error of selection of 20.7 g kg −1 ”
✓ located verbatim in the source · abstract, characters 795–840 t0 “QUALITY OF ALFALFA HERBAGE ”
✓ located verbatim in the source · title, characters 0–26 Other claims from this paper (5) Method / resource observed original result positive measured Claim · model-written summary
The best model had standard error of prediction 0.848%db.
standard error of prediction (SEP) e0 Verbatim
e0 “standard error of prediction (SEP) of 0.848%db ”
✓ located verbatim in the source · abstract, characters 1298–1344 t0 “Camellia Oleifera
✓ located verbatim in the source · title, characters 28–45 Other claims from this paper (6) Method / resource observed original result measured Claim · model-written summary
NIRs cross-validation standard error for TCC was 1.191.
Standard error of cross validation (SECV) for TCC e1 Verbatim
e0 “cassava roots ”
✓ located verbatim in the source · abstract, characters 69–82 e1 “Standard error of cross validation (SECV) for TCC and TBC were (1.191 and 0.837, respectively) ”
✓ located verbatim in the source · abstract, characters 650–744 Other claims from this paper (10) Method / resource observed original result measured Claim · model-written summary
NIRs cross-validation standard error for TBC was 0.837.
Verbatim
e0 “cassava roots ”
✓ located verbatim in the source · abstract, characters 69–82 e1 “Standard error of cross validation (SECV) for TCC and TBC were (1.191 and 0.837, respectively) ”
✓ located verbatim in the source · abstract, characters 650–744 Other claims from this paper (10) Method / resource observed original result measured Claim · model-written summary
The NIRS protein equation had a standard error of prediction of 0.568 %.
intact soybean e0 standard error of prediction e3 Verbatim
e0 “to determine the protein and oil contents of intact soybean ”
✓ located verbatim in the source · abstract, characters 102–161 e3 “standard error of prediction (SEP, protein: 0.568 % ”
✓ located verbatim in the source · abstract, characters 885–936 Other claims from this paper (8) Method / resource observed original result positive measured Claim · model-written summary
The monomolecular model had the lowest standard error and highest R-square.
monomolecular model e0 Verbatim
e0 “The lowest values of standard error and the highest values of R-square were calculated from the monomolecular model. ”
✓ located verbatim in the source · abstract, characters 375–491 t0 “Sesame Varieties ”
✓ located verbatim in the source · title, characters 115–131 Other claims from this paper (6) Method / resource observed original result measured Claim · model-written summary
The NIRS oil equation had a standard error of prediction of 0.451 %.
intact soybean e0 standard error of prediction e4 Verbatim
e0 “to determine the protein and oil contents of intact soybean ”
✓ located verbatim in the source · abstract, characters 102–161 e4 “standard error of prediction (SEP, protein: 0.568 %, oil : 0.451 % ”
✓ located verbatim in the source · abstract, characters 885–951 Other claims from this paper (8) Method / resource observed original result measured Claim · model-written summary
Making more than eight measurements per genotype gave little further reduction in the standard error of LWC measurements.
standard error of LWC measurements e4 little further reduction e4 eight measurements per genotype e4 Verbatim
e4 “It was concluded that little further reduction in the standard error of LWC measurements was obtained by making more than eight measurements per genotype, and it was important to sample on at least four tillers ”
✓ located verbatim in the source · abstract, characters 671–881 t0 “Assessment of the Response to Selection for Leaf Water Conductance in Lolium perenne ”
✓ located verbatim in the source · title, characters 0–84 Other claims from this paper (6) Method / resource observed original result measured Claim · model-written summary
The SPA-LS-SVM model predicted soluble solid content in garlic with a standard error of prediction of 1.01%.
Verbatim
e1 “predict allicin and SSC in garlic ”
✓ located verbatim in the source · abstract, characters 363–396 e2 “standard error of prediction (SEP) of 1.01% for SSC prediction ”
✓ located verbatim in the source · abstract, characters 1370–1432 Other claims from this paper (1) Method / resource observed original result positive measured Claim · model-written summary
The standard error of prediction of the progeny effect was lower than the standard deviation of the BLUE estimate.
standard error of prediction of the progeny effect e2 standard deviation of the best linear unbiased estimation (BLUE) estimate e2 Verbatim
e0 “Seven progeny tests from two RRS programmes with popcorn ( Zea mays L. ssp. mays [syn. Zea mays L. ssp. everta (Sturtev.) Zhuk.]) populations ”
✓ located verbatim in the source · abstract, characters 168–309 e2 “The standard error of prediction of the progeny effect was lower than the standard deviation of the best linear unbiased estimation (BLUE) estimate ”
✓ located verbatim in the source · abstract, characters 699–846 Other claims from this paper (6) Lexical search (BM25). All words must match; if nothing does, any word. Organism names also match every spelling of the same organism. No semantic search yet.
 Medicago sativat0
 Camellia oleifera
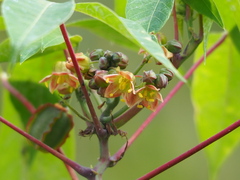 Manihot esculenta
 Glycine max
 Sesamum indicum
 Lolium perenne
 Allium sativum