View: List Claim type Research area Organism Taxon as written Decade Paper A claim can belong to several research areas, so group counts add up to more than the total.
Method / resource observed original result positive measured Claim · model-written summary
Prediction error was frequently less than calibration error .
prediction error e2 calibration error e2 Verbatim
t0 “Predictors of Alfalfa Forage Quality ”
✓ located verbatim in the source · title, characters 0–36 e2 “the prediction error frequently was less than the calibration error ”
✓ located verbatim in the source · abstract, characters 1110–1177 Other claims from this paper (5) Method / resource observed original result negative measured Claim · model-written summary
EONR prediction error was about three times higher than yield prediction error across forecast times.
prediction error of EONR e0 yield predictions e0 Verbatim
e0 “Across all forecast times, prediction error of EONR was about three times higher than yield prediction s. ”
✓ located verbatim in the source · abstract, characters 1789–1893 t0 “Corn ”
✓ located verbatim in the source · title, characters 40–44 Other claims from this paper (6) Method / resource observed original result measured Claim · model-written summary
The root-mean-square error of prediction and the standard error of prediction were both 0.0026.
the root-means-square error of prediction (RMSEP) and the standard error of prediction (SEP) e1 Verbatim
e1 “Accordingly, the root-means-square error of prediction (RMSEP) and the standard error of prediction (SEP) are both 0.0026 ”
✓ located verbatim in the source · abstract, characters 1026–1147 e2 “Seven varieties of foxtail millet were successfully identified ”
✓ located verbatim in the source · abstract, characters 510–572 Other claims from this paper (5) Method / resource observed original result positive measured Claim · model-written summary
Prediction error was frequently less than calibration error .
prediction error e2 calibration error e2 Verbatim
t0 “Predictors of Alfalfa Forage Quality ”
✓ located verbatim in the source · title, characters 0–36 e2 “the prediction error frequently was less than the calibration error ”
✓ located verbatim in the source · abstract, characters 1110–1177 Other claims from this paper (5) Method / resource observed original result negative measured Claim · model-written summary
EONR prediction error was about three times higher than yield prediction error across forecast times.
prediction error of EONR e0 yield predictions e0 Verbatim
e0 “Across all forecast times, prediction error of EONR was about three times higher than yield prediction s. ”
✓ located verbatim in the source · abstract, characters 1789–1893 t0 “Corn ”
✓ located verbatim in the source · title, characters 40–44 Other claims from this paper (6) Method / resource observed original result measured Claim · model-written summary
The root-mean-square error of prediction and the standard error of prediction were both 0.0026.
the root-means-square error of prediction (RMSEP) and the standard error of prediction (SEP) e1 Verbatim
e1 “Accordingly, the root-means-square error of prediction (RMSEP) and the standard error of prediction (SEP) are both 0.0026 ”
✓ located verbatim in the source · abstract, characters 1026–1147 e2 “Seven varieties of foxtail millet were successfully identified ”
✓ located verbatim in the source · abstract, characters 510–572 Other claims from this paper (5) Method / resource observed original result measured Claim · model-written summary
The average prediction error of the model was within 14% of the mean absolute error .
average prediction error e5 mean absolute error e5 Verbatim
e5 “The average prediction error was within 14% of the mean absolute error ”
✓ located verbatim in the source · abstract, characters 2532–2602 Other claims from this paper (4) Method / resource observed original result measured Claim · model-written summary
Standard error of prediction was 0.562.
standard error of prediction e1 Verbatim
e0 “Fuji apple ”
✓ located verbatim in the source · abstract, characters 143–153 e1 “standard error of prediction (SEP) 0.562 ”
✓ located verbatim in the source · abstract, characters 710–750 Other claims from this paper (3) Method / resource observed original result negative significant (as stated) measured Claim · model-written summary
Direct prediction of in-vitro digestibility had significantly more error than prediction of ADF and NDF.
prediction of ADF and NDF e0 Verbatim
e0 “significant increases in error compared to prediction of ADF and NDF ”
✓ located verbatim in the source · abstract, characters 1480–1548 t0 “alfalfa ”
✓ located verbatim in the source · title, characters 62–69 Other claims from this paper (6) Method / resource observed original result measured Claim · model-written summary
The volume prediction standard error was 9.41.
standard error of prediction e0 Verbatim
e0 “the standard error of prediction was 9.41 ”
✓ located verbatim in the source · abstract, characters 615–656 t0 “mango ”
✓ located verbatim in the source · title, characters 22–27 Other claims from this paper (2) Method / resource observed original result positive measured Claim · model-written summary
The confusion matrix showed a very low prediction error rate.
prediction error rate e0 Not reported Comparator Value
Verbatim
e0 “the confusion matrix shows a very low prediction error rate ”
✓ located verbatim in the source · abstract, characters 1269–1328 Other claims from this paper (3) Method / resource observed original result measured Claim · model-written summary
The modified model reduced volume prediction error by 70%.
prediction error e0 Verbatim
e0 “the prediction of the volume reduced the prediction error by 70% ”
✓ located verbatim in the source · abstract, characters 579–643 t0 “PINUS TAEDA ”
✓ located verbatim in the source · title, characters 61–72 Other claims from this paper (2) Method / resource observed original result measured Claim · model-written summary
Prediction error ranged from zero to eight days.
error of prediction e0 Not reported Taxon
Verbatim
e0 “Overall, the error of prediction ranged from 0 to 8 days ”
✓ located verbatim in the source · abstract, characters 779–835 Other claims from this paper (2) Method / resource observed original result positive measured Claim · model-written summary
The approach reduced wheat maturity prediction error .
prediction error of wheat maturity e0 Not reported Comparator Value
Verbatim
e0 “experiment reduced the prediction error of wheat maturity ”
✓ located verbatim in the source · abstract, characters 1002–1059 Other claims from this paper (3) Method / resource observed original result positive measured Claim · model-written summary
Prediction error was below 5%.
prediction error e1 Not reported Comparator
Verbatim
e0 “development stages of sunflower and potato ”
✓ located verbatim in the source · abstract, characters 308–350 e1 “prediction error lower than 5% ”
✓ located verbatim in the source · abstract, characters 832–862 Other claims from this paper (5) Method / resource observed original result positive measured Claim · model-written summary
The proposed model had a minimal prediction error of 0.15.
prediction error e0 Verbatim
e0 “a minimal prediction error of 0.15 ”
✓ located verbatim in the source · abstract, characters 1818–1852 Other claims from this paper (4) Method / resource observed original result measured Claim · model-written summary
The SA-CCT model had mean square error of 0.2357 for blackpod prediction .
Mean Square Error e0 Verbatim
e0 “Mean Square Error : 0.2357 ”
✓ located verbatim in the source · abstract, characters 952–977 Other claims from this paper (3) Method / resource observed original result measured Claim · model-written summary
The Australian model had 21·9% overall prediction error .
overall prediction error e0 Not reported Material
Verbatim
e0 “the overall prediction error was 21·9% for the Australian and 22·1% for the South American model ”
✓ located verbatim in the source · abstract, characters 814–910 e1 “Stylosanthes scabra caused by Colletotrichum gloeosporioides
✓ located verbatim in the source · abstract, characters 183–243 Other claims from this paper (8) Method / resource observed original result positive measured Claim · model-written summary
Accuracy from prediction error variance was a useful indicator of genomic prediction accuracy.
accuracy of prediction e0 accuracy of genomic breeding values from the prediction error variance e0 Not reported Taxon
Verbatim
e0 “the accuracy of genomic breeding values from the prediction error variance derived from the mixed model equations is a useful indicator of the accuracy of prediction . ”
✓ located verbatim in the source · abstract, characters 1061–1227 Other claims from this paper (5) Method / resource observed original result measured Claim · model-written summary
SPASIBA had median spatial prediction error of 188.7 km.
median prediction error e0 Verbatim
e0 “Continuous spatial prediction with SPASIBA showed a median prediction error of 188.7 km ”
✓ located verbatim in the source · abstract, characters 1078–1165 e1 “Cedrela odorata (Spanish cedar)
✓ located verbatim in the source · abstract, characters 186–217 Other claims from this paper (4) Method / resource observed original result positive measured Claim · model-written summary
Multiple covariates can improve prediction accuracy or reduce normalized root mean square error .
prediction accuracy or reduce the normalized root mean square error e0 Not reported Comparator
Verbatim
e0 “incorporating multiple covariates can improve prediction accuracy or reduce the normalized root mean square error ”
✓ located verbatim in the source · abstract, characters 1301–1414 t0 “wheat ”
✓ located verbatim in the source · title, characters 90–95 Other claims from this paper (7) Method / resource observed original result measured Claim · model-written summary
Mean absolute prediction error was 13%.
mean absolute prediction error e0 Verbatim
e0 “with a mean absolute prediction error of only 13% ”
✓ located verbatim in the source · abstract, characters 1751–1800 Other claims from this paper (8) Method / resource observed original result positive measured Claim · model-written summary
Validation prediction error variance was 0.042.
prediction error variance e0 Verbatim
e0 “prediction error variance was 0.042 ”
✓ located verbatim in the source · abstract, characters 1692–1727 t0 “Northern Mixed-Grass Prairie ”
✓ located verbatim in the source · title, characters 35–63 e2 “N content of forage using dead:green ratios ”
✓ located verbatim in the source · abstract, characters 299–342 Other claims from this paper (6) Method / resource observed original result positive measured Claim · model-written summary
The fitted equation had prediction error variance of 0.026.
prediction error variance e0 Verbatim
e0 “prediction error variance was 0.026 ”
✓ located verbatim in the source · abstract, characters 1055–1090 t0 “Northern Mixed-Grass Prairie ”
✓ located verbatim in the source · title, characters 35–63 e2 “N content of forage using dead:green ratios ”
✓ located verbatim in the source · abstract, characters 299–342 Other claims from this paper (6)
not stated 1 Recommendation author interpretation original result positive basis n/a Claim · model-written summary
The authors recommend improving the survey design and decreasing measurement error .
improve the survey design and decrease measurement error e7 Verbatim
t0 “cassava mosaic virus disease ”
✓ located verbatim in the source · title, characters 72–100 e7 “Large relative prediction error s obtained in the regression kriging procedure show the need to improve the survey design and decrease measurement error ”
✓ located verbatim in the source · abstract, characters 1118–1269 Other claims from this paper (12) Lexical search (BM25). All words must match; if nothing does, any word. Organism names also match every spelling of the same organism. No semantic search yet.
 Medicago sativat0
 Zea mays subsp. mays
 Setaria italica
 Mangifera indica
 Pinus taeda
 Triticum aestivum
 Solanum tuberosum
 Helianthus annuus
 Stylosanthes scabra
 Cedrela odorata
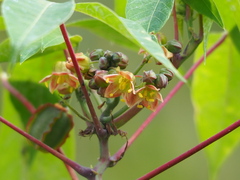 Manihot esculenta