Abstract
The field experiment was conducted in irrigated Alfisols of North coastal Andhra Pradesh tostudy the effect of biochar and chemical fertilizers on rhizosphere microbiome, soil enzymes andyield performance of groundnut crop (variety K-6) during rabi, 2018-19. Biochar application tosoil significantly increased soil bacterial, fungal and actinomycetes population. At pod developmentstage, the highest number of bacterial count (39.0 x10⁶ CFU g-1 soil) was observed in T5 (100%RDF + biochar @ 6 t ha-1) which was on par with all the biochar applied treatments (T3, T4, T6, T7,T8). The Biochar applied @ 6 t ha-1 (T5 & T8) significantly increased the bacterial population ascompared to non-biochar applied treatments (T1 & T2). Fungal and actinomycetes populationfollowed the similar trend of bacterial count. Soil urease activity was significantly superior inbiochar applied treatments (T3, T4, T5, T6, T7, T8) compared to non biochar applied treatments (T1and T2). With increased rates of biochar application the urease activity markedly increased insoil. Similar trend was noticed with respect to dehydrogenase, acid phosphatase and alkalinephosphatase enzymes in soil in response to addition of biochar. At pod development stage, thehighest leaf area index (3.16) was recorded with 100% RDF + biochar @ 6 t ha-1(T5) which wassignificantly higher than T1 (control), T2 (100% RDF) and T6 (75% RDF + biochar @ 2 t ha-1). Thehighest drymatter accumulation of 2951 kg ha-1 at peg penetration and 6428 kg ha-1 at poddevelopment was observed in T5 (100% RDF + biochar @ 6 t ha-1) which was on par with T3(100% RDF + biochar @ 2 t ha-1), T4 (100% RDF + biochar @ 4 t ha-1), T8 (75% RDF + biochar @6 t ha-1) treatments. Groundnut pod yield was highest (4019.58 kg ha-1) in treatment received100% RDF + biochar @ 6 t ha-1, which was on par with T4 (100% RDF + biochar @ 6 t ha-1) and T8(75% RDF + biochar @ 6 t ha-1).
Abstract from the paper’s OpenAlex record; open copy licensed cc-by-nc-sa. Read at the source ↗
The text the model read, with the source record’s inline markup (italics, sub- and superscripts) rendered and its character entities decoded; quote offsets refer to the raw text.
Claims 11
Claim · model-written summary
Biochar increased soil bacterial, fungal and actinomycete populations.
- Taxon
- groundnut
 Arachis hypogaeae1
- Treatment
- Biochare0
- Outcome
- soil bacterial, fungal and actinomycetes populatione0
- Direction
- increasede0
Not reportedComparator
Organisms pictured · Representative pictures of the matched species, not figures from the paper.
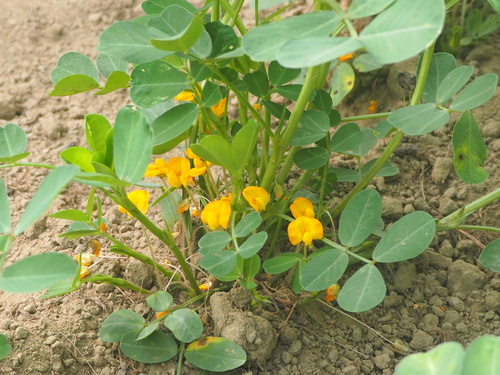
Verbatim
e0“Biochar application tosoil significantly increased soil bacterial, fungal and actinomycetes population”
e1“groundnut crop”
Claim · model-written summary
T5 gave the highest bacterial count at pod development, 39.0 x10⁶ CFU g-1 soil.
- Taxon
- groundnutArachis hypogaeae1
- Organ / stage
- pod developmentstagee0
- Treatment
- 100%RDF + biochar @ 6 t ha-1e0
- Outcome
- bacterial counte0
- Direction
- higheste0
- Value
- 39.0 x10⁶ CFU g-1 soile0
- Comparator
- all the biochar applied treatmentse0
Organisms pictured · Representative pictures of the matched species, not figures from the paper.
Verbatim
e0“At pod developmentstage, the highest number of bacterial count (39.0 x10⁶ CFU g-1 soil) was observed in T5 (100%RDF + biochar @ 6 t ha-1) which was on par with all the biochar applied treatments (T3, T4, T6, T7,T8)”
e1“groundnut crop”
Claim · model-written summary
Biochar at 6 t ha-1 increased bacterial populations over non-biochar treatments.
- Taxon
- groundnutArachis hypogaeae1
- Treatment
- Biochar applied @ 6 t ha-1e0
- Outcome
- bacterial populatione0
- Direction
- increasede0
- Comparator
- non-biochar applied treatmentse0
Organisms pictured · Representative pictures of the matched species, not figures from the paper.
Verbatim
e0“The Biochar applied @ 6 t ha-1 (T5 & T8) significantly increased the bacterial population ascompared to non-biochar applied treatments (T1 & T2)”
e1“groundnut crop”
Claim · model-written summary
Fungal and actinomycete populations followed the bacterial-count trend.
- Taxon
- groundnutArachis hypogaeae1
- Outcome
- Fungal and actinomycetes populatione0
Organisms pictured · Representative pictures of the matched species, not figures from the paper.
Verbatim
e0“Fungal and actinomycetes populationfollowed the similar trend of bacterial count”
e1“groundnut crop”
Claim · model-written summary
Biochar treatments produced significantly higher soil urease activity than non-biochar treatments.
- Taxon
- groundnutArachis hypogaeae1
- Treatment
- biochar applied treatmentse0
- Outcome
- Soil urease activitye0
- Direction
- superiore0
- Comparator
- non biochar applied treatmentse0
Organisms pictured · Representative pictures of the matched species, not figures from the paper.
Verbatim
e0“Soil urease activity was significantly superior inbiochar applied treatments (T3, T4, T5, T6, T7, T8) compared to non biochar applied treatments (T1and T2)”
e1“groundnut crop”
Claim · model-written summary
Increasing biochar rates markedly increased soil urease activity.
- Taxon
- groundnutArachis hypogaeae1
- Treatment
- biochar applicatione0
- Outcome
- urease activitye0
- Direction
- increasede0
Organisms pictured · Representative pictures of the matched species, not figures from the paper.
Verbatim
e0“With increased rates of biochar application the urease activity markedly increased insoil”
e1“groundnut crop”
Claim · model-written summary
Soil dehydrogenase, acid phosphatase and alkaline phosphatase followed the biochar response trend.
- Taxon
- groundnutArachis hypogaeae1
- Treatment
- addition of biochare0
- Outcome
- dehydrogenase, acid phosphatase and alkalinephosphatase enzymes in soile0
Not reportedComparatorDirection
Organisms pictured · Representative pictures of the matched species, not figures from the paper.
Verbatim
e0“Similar trend was noticed with respect to dehydrogenase, acid phosphatase and alkalinephosphatase enzymes in soil in response to addition of biochar”
e1“groundnut crop”
Claim · model-written summary
T5 yielded the highest leaf area index at pod development, 3.16, above T1, T2 and T6.
- Taxon
- groundnutArachis hypogaeae1
- Organ / stage
- pod development stagee0
- Treatment
- 100% RDF + biochar @ 6 t ha-1e0
- Outcome
- leaf area indexe0
- Direction
- highere0
- Value
- 3.16e0
- Comparator
- T1 (control), T2 (100% RDF) and T6 (75% RDF + biochar @ 2 t ha-1)e0
Organisms pictured · Representative pictures of the matched species, not figures from the paper.
Verbatim
e0“At pod development stage, thehighest leaf area index (3.16) was recorded with 100% RDF + biochar @ 6 t ha-1(T5) which wassignificantly higher than T1 (control), T2 (100% RDF) and T6 (75% RDF + biochar @ 2 t ha-1)”
e1“groundnut crop”
Claim · model-written summary
T5 gave highest dry matter at peg penetration, 2951 kg ha-1.
- Taxon
- groundnutArachis hypogaeae1
- Organ / stage
- peg penetratione0
- Treatment
- 100% RDF + biochar @ 6 t ha-1e0
- Outcome
- drymatter accumulatione0
- Direction
- higheste0
- Value
- 2951 kg ha-1e0
Not reportedComparator
Organisms pictured · Representative pictures of the matched species, not figures from the paper.
Verbatim
e0“Thehighest drymatter accumulation of 2951 kg ha-1 at peg penetration and 6428 kg ha-1 at poddevelopment was observed in T5 (100% RDF + biochar @ 6 t ha-1)”
e1“groundnut crop”
Claim · model-written summary
T5 gave highest dry matter at pod development, 6428 kg ha-1.
- Taxon
- groundnutArachis hypogaeae1
- Organ / stage
- poddevelopmente0
- Treatment
- 100% RDF + biochar @ 6 t ha-1e0
- Outcome
- drymatter accumulatione0
- Direction
- higheste0
- Value
- 6428 kg ha-1e0
Not reportedComparator
Organisms pictured · Representative pictures of the matched species, not figures from the paper.
Verbatim
e0“Thehighest drymatter accumulation of 2951 kg ha-1 at peg penetration and 6428 kg ha-1 at poddevelopment was observed in T5 (100% RDF + biochar @ 6 t ha-1)”
e1“groundnut crop”
Claim · model-written summary
T5 gave the highest groundnut pod yield, 4019.58 kg ha-1.
- Taxon
- GroundnutArachis hypogaeae0
- Treatment
- 100% RDF + biochar @ 6 t ha-1e0
- Outcome
- pod yielde0
- Direction
- higheste0
- Value
- 4019.58 kg ha-1e0
- Comparator
- T4e0
Organisms pictured · Representative pictures of the matched species, not figures from the paper.
Verbatim
e0“Groundnut pod yield was highest (4019.58 kg ha-1) in treatment received100% RDF + biochar @ 6 t ha-1, which was on par with T4 (100% RDF + biochar @ 6 t ha-1) and T8(75% RDF + biochar @ 6 t ha-1)”
The same questions in other papers
fertilization · soil: biology · Arachis hypogaea (peanut)Positive and negative results
11 papers in the same direction as this paper · 1 in the opposite direction
- no effect
- positive
- positive
9 papers more in this group
See all 13 papers →biochar · yield · Arachis hypogaea (peanut)Positive and negative results
28 papers in the same direction as this paper · 3 in the opposite direction
- no effect
- no effect
- no effect
28 papers more in this group
See all 32 papers →fertilization · growth · Arachis hypogaea (peanut)Positive and negative results
181 papers in the same direction as this paper · 22 in the opposite direction
- no effect
- no effect
- no effect
200 papers more in this group
See all 204 papers →fertilization · yield · Arachis hypogaea (peanut)Positive and negative results
634 papers in the same direction as this paper · 44 in the opposite direction · 4 reporting no difference from an alternative
- no effect
- negative
- no effect
679 papers more in this group
See all 683 papers →biochar · physiology: enzyme activity · Arachis hypogaea (peanut)Results agree
1 paper in the same direction as this paper
- positive
biochar · molecular: metabolites · Arachis hypogaea (peanut)Results agree
5 papers in the same direction as this paper
- positive
- positive
- positive
2 papers more in this group
See all 6 papers →biochar · soil: biology · Arachis hypogaea (peanut)Results agree
6 papers in the same direction as this paper
- positive
- positive
- positive
3 papers more in this group
See all 7 papers →biochar · growth · Arachis hypogaea (peanut)Results agree
9 papers in the same direction as this paper
- positive
- positive
- positive
6 papers more in this group
See all 10 papers →8 of 9 groups shown: named compounds and organisms first, then groups whose results differ (checked claim by claim), then those with positive and negative results, then the smaller groups.
Claims are grouped by organism, treatment and what was measured or targeted. A paper counts as positive when any of its claims in the group is positive.