View: List Claim type Research area Organism Taxon as written Decade Paper Observation observed original result measured Claim · model-written summary
Heating degree days with daily minima below 2.2C were inefficient.
Heating degree days with daily minima <2.2C are inefficient e0 Verbatim
e0 “Heating degree days with daily minima <2.2C are inefficient ”
✓ located verbatim in the source · abstract, characters 581–640 t0 “Pecan ”
✓ located verbatim in the source · title, characters 31–36 Other claims from this paper (6) Observation author interpretation original result measured Claim · model-written summary
Total chlorophyll content suggested a daily rhythm with two maxima and minima .
daily rhythm in total chlorophyll content e0 two maxima and minima e0 Verbatim
e0 “suggesting a daily rhythm in total chlorophyll content with two maxima and minima ”
✓ located verbatim in the source · abstract, characters 409–490 t0 “Norway spruce needles ”
✓ located verbatim in the source · title, characters 30–51 Other claims from this paper (5) Association observed original result measured Claim · model-written summary
Flower bud cold hardiness of apricot was correlated better with mean maximum daily temperature for the preceding 7 days than with mean minima .
mean maximum daily temperature e0 correlated better e0 Verbatim
t0 “Seasonal variation of cold hardiness in apricots ”
✓ located verbatim in the source · title, characters 0–48 e0 “cold hardiness was correlated better with mean maximum daily temperature for the 7 days before measurements than with mean minima ”
✓ located verbatim in the source · abstract, characters 215–344 Other claims from this paper (2) Association observed original result measured Claim · model-written summary
Raffinose was best correlated with the frequency of daily minima at or below 1.7C in the previous 30 days.
Rafflnose concentrations e0 30 days before sampling e0 daily minima ≤ 1.7C e0 Not reported Direction
Verbatim
e0 “Rafflnose concentrations were highest during winter and were best correlated with the frequency of occurrence of daily minima ≤ 1.7C during the 30 days before sampling ”
✓ located verbatim in the source · abstract, characters 417–584 t0 “Conifer Species ”
✓ located verbatim in the source · title, characters 37–52 t1 “Conifer Species ”
✓ located verbatim in the source · title, characters 37–52 Other claims from this paper (7) Association observed original result measured Claim · model-written summary
Sucrose was best correlated with frequency of daily minima at or below 7.2C in the prior 30 days.
Sucrose concentrations e0 daily minima ≤ 7.2C e0 Not reported Direction
Verbatim
e0 “Sucrose concentrations, which also reached maximum levels during the winter, were best correlated with the frequency of occurrence of daily minima ≤ 7.2C in the prior 30 days ”
✓ located verbatim in the source · abstract, characters 586–760 t0 “Conifer Species ”
✓ located verbatim in the source · title, characters 37–52 t1 “Conifer Species ”
✓ located verbatim in the source · title, characters 37–52 Other claims from this paper (7) Observation observed original result measured Claim · model-written summary
Male and female trees flowered synchronously with daily display maxima at 1800-0600 and minima at 1400-1800.
Male and female trees e0 flowered in synchrony producing daily display maxima at 1800-0600 and display minima at 1400-1800 e0 Verbatim
e0 “Male and female trees flowered in synchrony producing daily display maxima at 1800-0600 and display minima at 1400-1800 ”
✓ located verbatim in the source · abstract, characters 392–511 t0 “Myristica insipida
✓ located verbatim in the source · title, characters 33–51 Other claims from this paper (11) Observation observed original result measured Claim · model-written summary
Hevea laticiferous phloem pressure fluctuated daily , with minima during the day.
laticiferous phloem tissues e0 Hydrostatic pressures e0 minimum values e0 during the day e0 Verbatim
e0 “Hydrostatic pressures in laticiferous phloem tissues of Hevea brasiliensis trees exhibit a diurnal fluctuation, with minimum values occurring during the day. ”
✓ located verbatim in the source · abstract, characters 0–157 Other claims from this paper (2) Observation observed original result measured Claim · model-written summary
Well-watered Persea americana maintained a zero-slope signal with daily maxima and minima of similar magnitude over time.
continuous signal e0 daily maximum and a minimum EP of similar magnitude in time e0 Verbatim
e0 “Well-watered plants presented a continuous signal with daily maximum and a minimum EP of similar magnitude in time, with zero slope. ”
✓ located verbatim in the source · abstract, characters 1958–2090 e1 “both in Persea americana and Prunus domestica plants. ”
✓ located verbatim in the source · abstract, characters 993–1046 Other claims from this paper (15) Observation observed original result measured Claim · model-written summary
Well-watered Prunus domestica maintained a zero-slope signal with daily maxima and minima of similar magnitude over time.
continuous signal e0 daily maximum and a minimum EP of similar magnitude in time e0 Verbatim
e0 “Well-watered plants presented a continuous signal with daily maximum and a minimum EP of similar magnitude in time, with zero slope. ”
✓ located verbatim in the source · abstract, characters 1958–2090 e1 “both in Persea americana and Prunus domestica plants. ”
✓ located verbatim in the source · abstract, characters 993–1046 Other claims from this paper (15) Observation observed original result measured Claim · model-written summary
Daily net photosynthetic rate was bimodal, with minima at noon and 14:00.
daily net photosynthetic rate (Pn) variation graph displayed a typical bimodal curve e0 12:00 pm and 14:00 e0 Verbatim
t0 “sweet cherry (Prunus avium L.) ”
✓ located verbatim in the source · title, characters 97–127 e0 “The daily net photosynthetic rate (Pn) variation graph displayed a typical bimodal curve, with the lowest values occurring successively at 12:00 pm and 14:00 ”
✓ located verbatim in the source · abstract, characters 685–842 Other claims from this paper (7) Lexical search (BM25). All words must match; if nothing does, any word. Organism names also match every spelling of the same organism. No semantic search yet.
 Carya illinoinensist0
 Picea abies
 Prunus armeniaca
 Myristica insipida
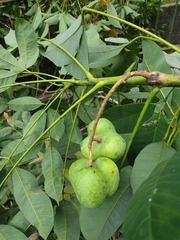 Hevea brasiliensis
 Persea americana
 Prunus domestica
 Prunus avium