View: List Claim type Research area Organism Taxon as written Decade Paper Method / resource observed original result positive measured Claim · model-written summary
The calibration regression equation was Y=13.664X+0.0389.
regression equation e0 Verbatim
e0 “the regression equation was Y=13.664X+0.0389 ”
✓ located verbatim in the source · abstract, characters 537–581 t0 “sorghum grain ”
✓ located verbatim in the source · title, characters 57–70 Other claims from this paper (8) Method / resource author interpretation original result positive measured Claim · model-written summary
One calibration equation predicted moisture accurately across different shelled and unshelled peanut types.
moisture content can be accurately predicted e0 different peanut types e0 Verbatim
e0 “Therefore, by using microwave moisture sensing, moisture content can be accurately predicted in different peanut types with a single calibration equation . ”
✓ located verbatim in the source · abstract, characters 645–799 Other claims from this paper (2) Method / resource observed review summary basis n/a Claim · model-written summary
A reliable prediction equation or calibration model is the major constraint for NIRS.
major constraint e0 a calibration model e0 Verbatim
e0 “The major constraint is, therefore, the need to build a reliable equation of prediction, also called a calibration model ”
✓ located verbatim in the source · abstract, characters 495–615 t0 “root crops ”
✓ located verbatim in the source · title, characters 53–63 Other claims from this paper (2) Method / resource observed original result measured Claim · model-written summary
The calibration regression equation for total flavonoids by spectrophotometry was A=0.01036C+0.00527.
Regression equation e1 A=0.01036C+0.00527 e1 Verbatim
e1 “Regression equation is A=0.01036C+0.00527 ”
✓ located verbatim in the source · abstract, characters 165–206 t0 “Elsholtzia Rugulosa
✓ located verbatim in the source · title, characters 77–96 Other claims from this paper (5) Method / resource observed original result measured Claim · model-written summary
The reported emodin calibration equation was Y=112.89X-8.912.
linear regression equation e0 Verbatim
e0 “the linear regression equation was Y=112.89X-8.912(r=0.999 9) ”
✓ located verbatim in the source · abstract, characters 493–554 t0 “Polygonum perfoliatum L.
✓ located verbatim in the source · title, characters 42–66 Other claims from this paper (4) Method / resource observed original result measured Claim · model-written summary
The vitamin C calibration equation was A=73.054 2C+50.689 8.
Fructus Chaenomelis t0 A=73.054 2C+50.689 8 e0 Verbatim
e0 “the liner equation was A=73.054 2C+50.689 8 ”
✓ located verbatim in the source · abstract, characters 408–451 t0 “Fructus Chaenomelis ”
✓ located verbatim in the source · title, characters 30–49 Other claims from this paper (5) Method / resource observed original result measured Claim · model-written summary
The calibration equation was y=1.0776x-4.1145 with r=0.9991.
y=1.0776x-4.1145 e0 Verbatim
e0 “The linear equation was y=1.0776x-4.1145,r=0.9991 ”
✓ located verbatim in the source · abstract, characters 528–577 e1 “inOsmanthus fragransLour. ”
✓ located verbatim in the source · abstract, characters 31–56 Other claims from this paper (7) Method / resource observed original result positive measured Claim · model-written summary
Moisture content calculated from the calibration equation had a mean of 17.3%, equal to the oven-determined values.
runner-type peanuts t0 Moisture contents calculated from the calibration equation e1 oven determined moisture contents e1 Verbatim
t0 “Runner-Type Peanuts ”
✓ located verbatim in the source · title, characters 57–76 e1 “Moisture contents calculated from the calibration equation had a 17.3% mean and an 8.5% SD equaling values for oven determined moisture contents ”
✓ located verbatim in the source · abstract, characters 909–1053 Other claims from this paper (2) Method / resource observed original result measured Claim · model-written summary
The best NIR equation had calibration R squared 0.90 and mean and standard error 7.93 ± 1.14.
Verbatim
e0 “The optimum equation had a calibration R 2 of 0.90 and a mean and standard error of 7.93 ± 1.14 ”
✓ located verbatim in the source · abstract, characters 607–702 t0 “Alfalfa ”
✓ located verbatim in the source · title, characters 31–38 Other claims from this paper (3) Method / resource observed original result measured Claim · model-written summary
The calibration regression equation was ŷ = 0.1211 + 0.0087x.
linear regression equation e0 Verbatim
e0 “with a linear regression equation of ŷ = 0.1211 + 0.0087x. ”
✓ located verbatim in the source · abstract, characters 556–614 t0 “Syzygium myrtifolium Walp.
✓ located verbatim in the source · title, characters 69–95 Other claims from this paper (4) Lexical search (BM25). All words must match; if nothing does, any word. Organism names also match every spelling of the same organism. No semantic search yet.
 Sorghum
 Arachis hypogaea
 Persicaria perfoliata
 Osmanthus fragrans
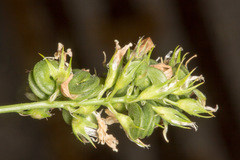 Medicago sativa
 Syzygium myrtifolium