View: List Claim type Research area Organism Taxon as written Decade Paper Method / resource observed original result positive measured Claim · model-written summary
An LAI-2000 calibration equation had R2=0.870.
calibration equation e0 Verbatim
e0 “A calibration equation (LAI=1.7787LAI2000–0.8816, R2=0.870**) was developed for LAI-2000. ”
✓ located verbatim in the source · abstract, characters 805–894 t0 “rice ”
✓ located verbatim in the source · title, characters 62–66 Other claims from this paper (6) Method / resource observed original result positive measured Claim · model-written summary
The 80% ethanol assay gave a better calibration equation .
calibration equation e0 80%‐ethanol assay e0 Verbatim
t0 “Alfalfa ”
✓ located verbatim in the source · title, characters 105–112 e0 “Because a better calibration equation was obtained with the 80%‐ethanol assay ”
✓ located verbatim in the source · abstract, characters 952–1029 Other claims from this paper (8) Method / resource observed original result positive measured Claim · model-written summary
Applying the empirical calibration equation yielded accurate LAI estimates.
empirical calibration equation e0 accurate LAI estimates e0 Not reported Comparator
Verbatim
e0 “By applying the empirical calibration equation , the measurements provide accurate LAI estimates. ”
✓ located verbatim in the source · abstract, characters 899–995 t0 “Grapevines ”
✓ located verbatim in the source · title, characters 54–64 Other claims from this paper (6) Recommendation author interpretation original result positive basis n/a Claim · model-written summary
The authors conclude that a robust calibration equation can be updated by the merge function and multivariate calibration .
updating robust calibration equation e1 Verbatim
e0 “to update the calibration that is used for the measurement of the total nitrogen content in the rice plant samples ”
✓ located verbatim in the source · abstract, characters 42–156 e1 “updating robust calibration equation from merge function and multi-variate calibration ”
✓ located verbatim in the source · abstract, characters 1556–1642 Other claims from this paper (15) Method / resource Before merging, the leaf calibration correlation coefficient for nitrogen content in rice was 0.945. Method / resource Before merging, the stem calibration correlation coefficient for nitrogen content in rice was 0.928. Method / resource Before merging, the whole-plant calibration correlation coefficient for nitrogen content in rice was 0.864. Method / resource The leaf calibration model was recorded with relatively high accuracy compared with the models for each part of the rice plant. Method / resource The PLS-developed calibration equation was more accurate than the MLR-developed equation for rice plant nitrogen. Association The calibration equation was sensitive to variety and location variations in rice. Method / resource After merging samples, the leaf R2 value of the calibration was 0.950. Method / resource After merging samples, the stem R2 value of the calibration was 0.974. Method / resource After merging samples, the whole-plant R2 value of the calibration was 0.940. Method / resource After removal of outliers, R2 values increased to 0.998, 0.995 and 0.997 for the calibration models. Association In the stem and whole plant, the standard error of prediction (SEP) was reduced. Association Biases of the calibration were reduced in the leaf, stem and whole plant. Association Slopes of the calibration were high in the stem. Association Standard deviation was reduced in the stem. Association R2 was high in the stem and whole plant. Intervention effect observed original result positive significant (as stated) measured Claim · model-written summary
Local calibration of the Hargreaves equation significantly improved the estimation of ETo.
Local calibration of Hargreaves equation e2 Not reported Comparator
Verbatim
t0 “PROCESSING TOMATO ”
✓ located verbatim in the source · title, characters 13–30 e2 “Local calibration of Hargreaves equation allowed a significant improvement of ETo estimation ”
✓ located verbatim in the source · abstract, characters 1169–1261 Other claims from this paper (3) Method / resource observed original result no effect measured Claim · model-written summary
The VSTE equation was not distinctly worse than VDLUFA calibration .
prediction accuracy e1 not distinctly worse e0 VDLUFA calibration equation e1 Verbatim
e0 “the former was not distinctly worse ”
✓ located verbatim in the source · abstract, characters 716–751 e1 “VSTE equation was compared to the prediction accuracy according to the VDLUFA calibration equation ”
✓ located verbatim in the source · abstract, characters 537–635 t0 “oilseed rape ”
✓ located verbatim in the source · title, characters 56–68 Other claims from this paper (4) Recommendation author interpretation original result basis n/a Claim · model-written summary
The authors prefer a calibration equation integrating sensor signal over time.
a calibration equation based on an integration of sensor signal over time e0 Verbatim
e0 “Derivation of a calibration equation based on an integration of sensor signal over time is considered more appropriate. ”
✓ located verbatim in the source · abstract, characters 1395–1514 t0 “CANE ”
✓ located verbatim in the source · title, characters 14–18 Other claims from this paper (6) Method / resource observed original result positive measured Claim · model-written summary
A linear calibration equation , T’ = 0.65 V + 0.39, was established to convert measured sap flow velocity to corrected transpiration rate.
linear calibration equation e0 T’ = 0.65 V + 0.39 e0 Verbatim
t0 “Sensors in Maize ”
✓ located verbatim in the source · title, characters 51–67 e0 “A linear calibration equation , T’ = 0.65 V + 0.39, was established ”
✓ located verbatim in the source · abstract, characters 1201–1267 Other claims from this paper (7) Method / resource observed original result positive measured Claim · model-written summary
The PLS-developed calibration equation was more accurate than the MLR-developed equation for rice plant nitrogen.
calibration equation e3 Partial least squares (PLS) method e3 Multiple linear regression (MLR) method e3 Verbatim
e0 “to update the calibration that is used for the measurement of the total nitrogen content in the rice plant samples ”
✓ located verbatim in the source · abstract, characters 42–156 e3 “the calibration equation developed by Partial least squares (PLS) method was more accurate than the Multiple linear regression (MLR) method ”
✓ located verbatim in the source · abstract, characters 590–729 Other claims from this paper (15) Method / resource Before merging, the leaf calibration correlation coefficient for nitrogen content in rice was 0.945. Method / resource Before merging, the stem calibration correlation coefficient for nitrogen content in rice was 0.928. Method / resource Before merging, the whole-plant calibration correlation coefficient for nitrogen content in rice was 0.864. Method / resource The leaf calibration model was recorded with relatively high accuracy compared with the models for each part of the rice plant. Association The calibration equation was sensitive to variety and location variations in rice. Method / resource After merging samples, the leaf R2 value of the calibration was 0.950. Method / resource After merging samples, the stem R2 value of the calibration was 0.974. Method / resource After merging samples, the whole-plant R2 value of the calibration was 0.940. Method / resource After removal of outliers, R2 values increased to 0.998, 0.995 and 0.997 for the calibration models. Association In the stem and whole plant, the standard error of prediction (SEP) was reduced. Association Biases of the calibration were reduced in the leaf, stem and whole plant. Association Slopes of the calibration were high in the stem. Association Standard deviation was reduced in the stem. Association R2 was high in the stem and whole plant. Recommendation The authors conclude that a robust calibration equation can be updated by the merge function and multivariate calibration. Method / resource observed original result positive measured Claim · model-written summary
The best NIRS calibration equation for TIVD had R2 of 0.92.
calibration equation for TIVD e4 Verbatim
e4 “The best NIRS calibration equation for TIVD had R 2 of 0.92 ”
✓ located verbatim in the source · abstract, characters 731–790 t0 “QUALITY OF ALFALFA HERBAGE ”
✓ located verbatim in the source · title, characters 0–26 Other claims from this paper (5) Lexical search (BM25). All words must match; if nothing does, any word. Organism names also match every spelling of the same organism. No semantic search yet.
 Oryza sativat0
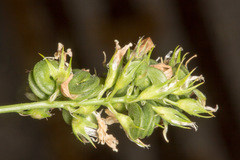 Medicago sativa
 Vitis
 Brassica napus
 Zea mays